Important Information

You are visiting the international Vantage Markets website, distinct from the website operated by Vantage Global Prime LLP
( www.vantagemarkets.co.uk ) which is regulated by the Financial Conduct Authority ("FCA").

This website is managed by Vantage Markets' international entities, and it's important to emphasise that they are not subject to regulation by the FCA in the UK. Therefore, you must understand that you will not have the FCA’s protection when investing through this website – for example:

  • You will not be guaranteed Negative Balance Protection
  • You will not be protected by FCA’s leverage restrictions
  • You will not have the right to settle disputes via the Financial Ombudsman Service (FOS)
  • You will not be protected by Financial Services Compensation Scheme (FSCS)
  • Any monies deposited will not be afforded the protection required under the FCA Client Assets Sourcebook. The level of protection for your funds will be determined by the regulations of the relevant local regulator.

If you would like to proceed and visit this website, you acknowledge and confirm the following:

  • 1.The website is owned by Vantage Markets' international entities and not by Vantage Global Prime LLP, which is regulated by the FCA.
  • 2.Vantage Global Limited, or any of the Vantage Markets international entities, are neither based in the UK nor licensed by the FCA.
  • 3.You are accessing the website at your own initiative and have not been solicited by Vantage Global Limited in any way.
  • 4.Investing through this website does not grant you the protections provided by the FCA.
  • 5.Should you choose to invest through this website or with any of the international Vantage Markets entities, you will be subject to the rules and regulations of the relevant international regulatory authorities, not the FCA.

Vantage wants to make it clear that we are duly licensed and authorised to offer the services and financial derivative products listed on our website. Individuals accessing this website and registering a trading account do so entirely of their own volition and without prior solicitation.

By confirming your decision to proceed with entering the website, you hereby affirm that this decision was solely initiated by you, and no solicitation has been made by any Vantage entity.

I confirm my intention to proceed and enter this website Please direct me to the website operated by Vantage Global Prime LLP, regulated by the FCA in the United Kingdom

By providing your email and proceeding to create an account on this website, you acknowledge that you will be opening an account with Vantage Global Limited, regulated by the Vanuatu Financial Services Commission (VFSC), and not the UK Financial Conduct Authority (FCA).

    Please tick all to proceed

  • Please tick the checkbox to proceed
  • Please tick the checkbox to proceed
Proceed Please direct me to website operated by Vantage Global Prime LLP, regulated by the FCA in the United Kingdom.

×

观看-重生成为交易者

hans

View More
SEARCH
  • 全部
    交易
    平台
    教育
    分析
    促销活动
    关于
  • Search
Keywords
  • 外汇
  • Vantage Rewards
  • 交易费用
  • facebook
  • instagram
  • twitter
  • linkedin
  • youtube
  • telegram
技术指标指南:类型和使用方式

目录

技术指标指南:类型和使用方式

技术指标指南:类型和使用方式

Vantage Updated Updated Thu, 2024 February 8 07:54

技术指标 

对于技术分析师来说,指标是可以为交易者提供市场另一种视角的工具。这些技术指标充当市场的解释者,交易者可以利用这些信息来发挥自己的优势。 

一般来说,技术指标源自价格行为的数学方程——这意味着它纯粹由数据驱动。指标在很多方面都很有用,例如识别市场状况和寻找进入或退出交易的区域。 

关键点 

  • 技术指标分为趋势、振荡和成交量类型,提供市场趋势的数学分析以及进入或退出交易的信号。 
  • 独立开发的自定义技术指标可以通过独特的数学计算增强交易策略,并且通常与其他指标结合以改进分析。 
  • 有效使用技术指标需要了解其局限性,避免过多指标造成的“分析瘫痪”,并结合价格行为等其他技术分析方法。 

技术指标类型 

指标有许多不同的形状和大小,但仍然分为 3 个主要类别:趋势指标、振荡指标和成交量指标。 

1. 趋势指标  

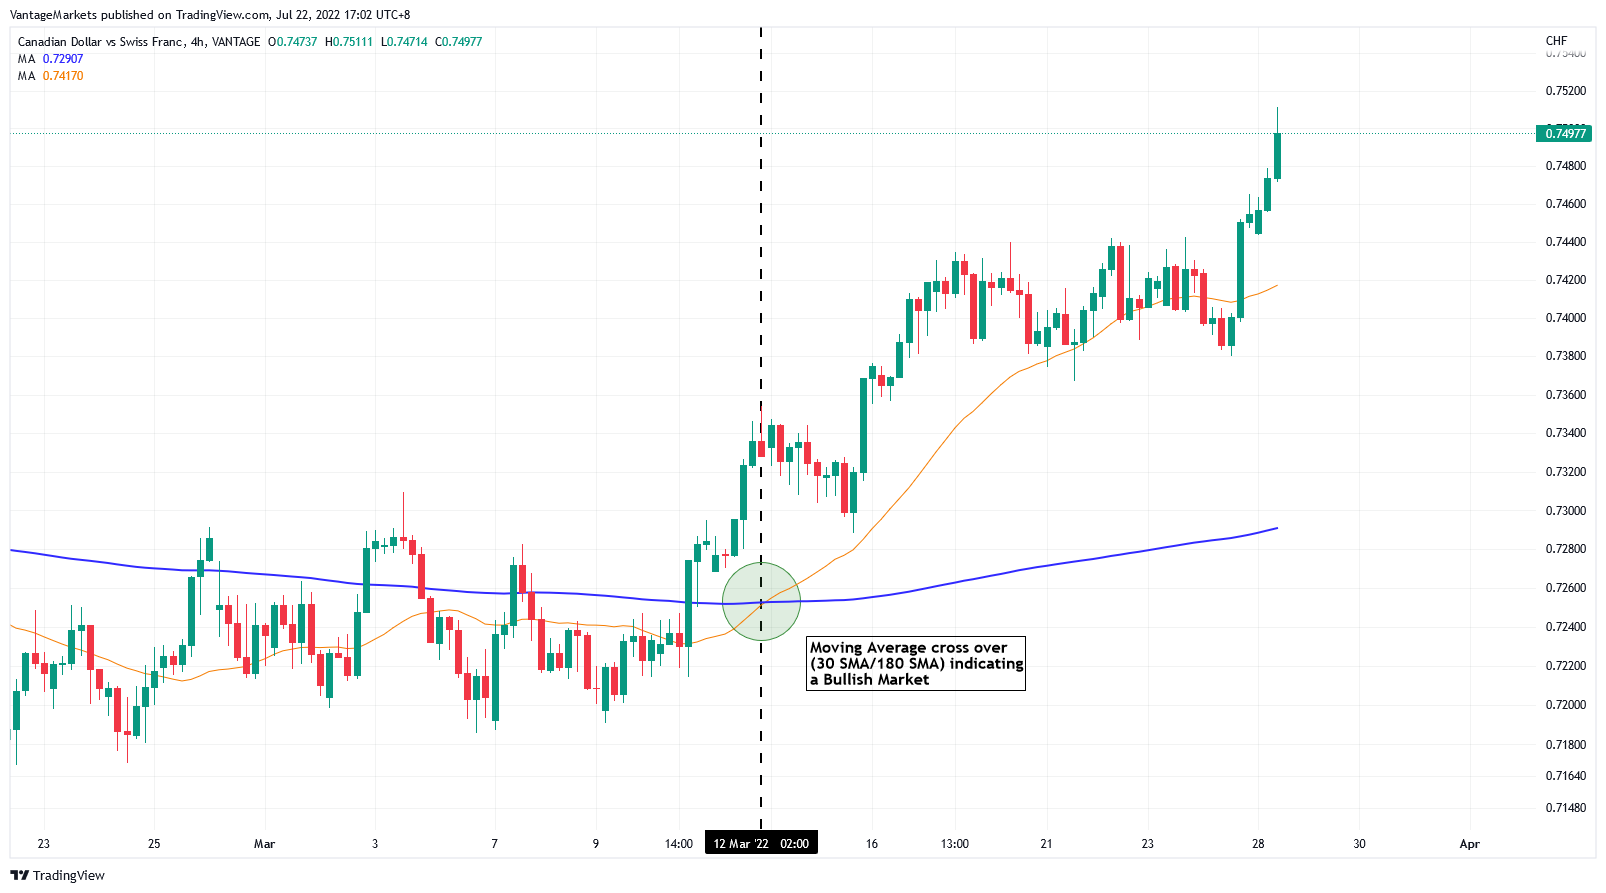
顾名思义,趋势指标帮助交易者识别市场趋势。它通常是根据过去价格行为的平均值计算出来的,形成一条平滑的线。俗话说“趋势是你的朋友”,想要交易趋势市场的交易者应该在他们的武器库中拥有一个趋势指标[1]。 

  • 流行趋势指标=移动平均线 

移动平均线是一种常用的技术分析工具,它通过在图表上叠加一条平滑线来计算金融工具价格的平均波动情况。 

图1 – 看涨市场中的 CADCHF H4 移动平均线 ( https://www.tradingview.com/x/0w3Ew8Af/ ) 

2. 振荡器指标 

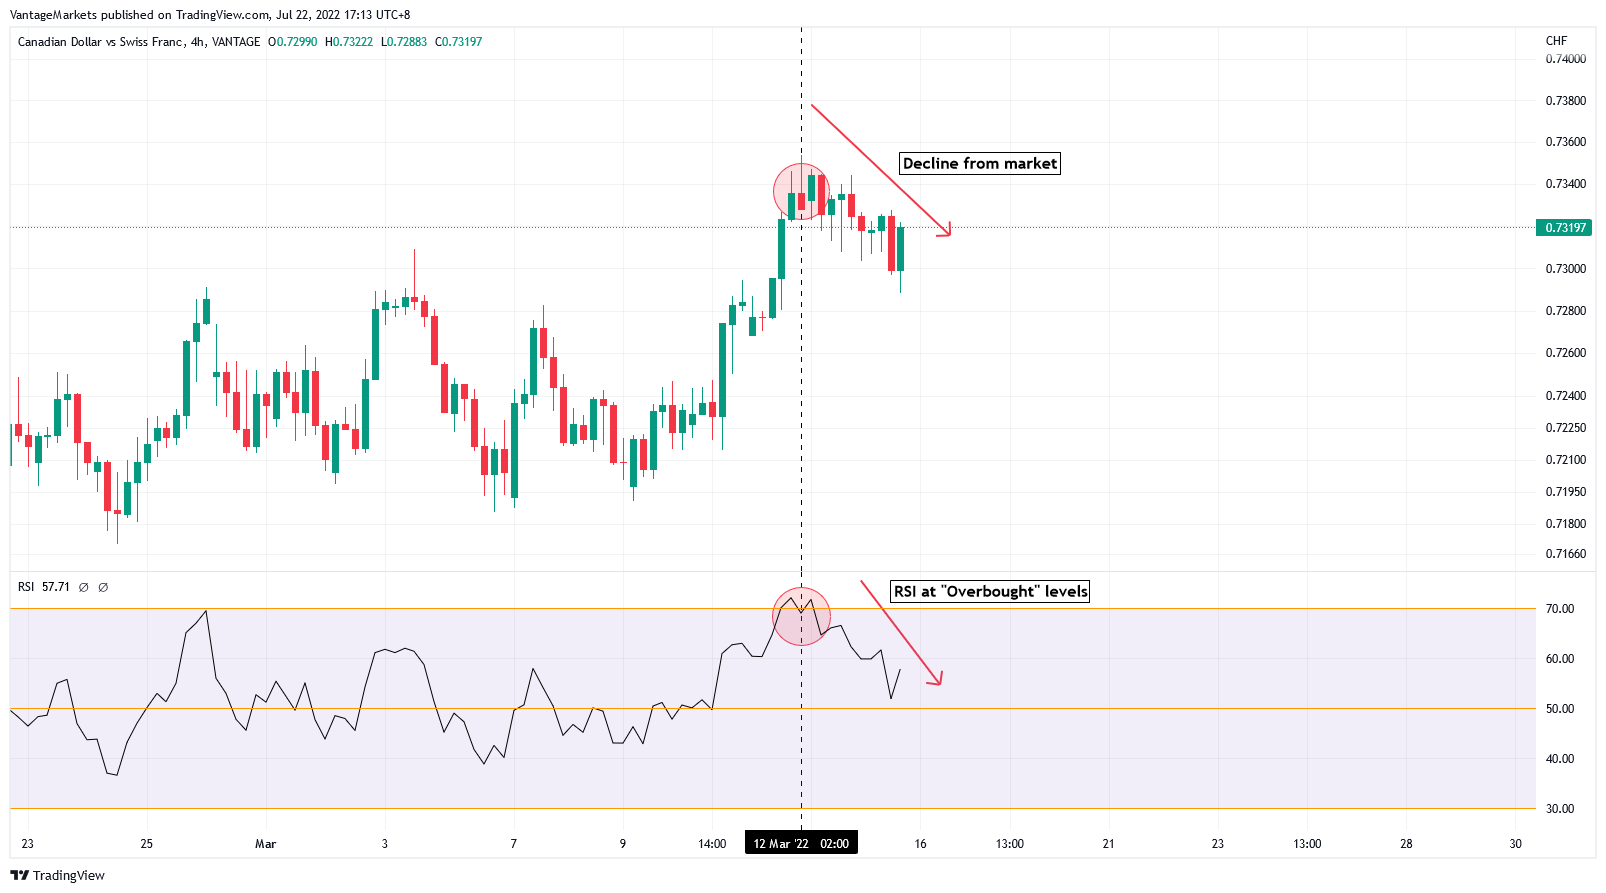
振荡指标是一种帮助交易者确定趋势强度的指标,它与市场的高点和低点同步变化。振荡指标的基本思想是能够确定市场中的“超买”和“超卖”状况[2]。 

  • 流行振荡指标 = 相对强弱指数 

相对强弱指数 (RSI) 是一种动量震荡指标,用于衡量价格变动的速度和变化,范围为 30(超卖)和 70(超买)。 

图2 – CADCHF H4 RSI 在牛市中“超买” ( https://www.tradingview.com/x/cx9X1N0F/ ) 

3. 成交量指标  

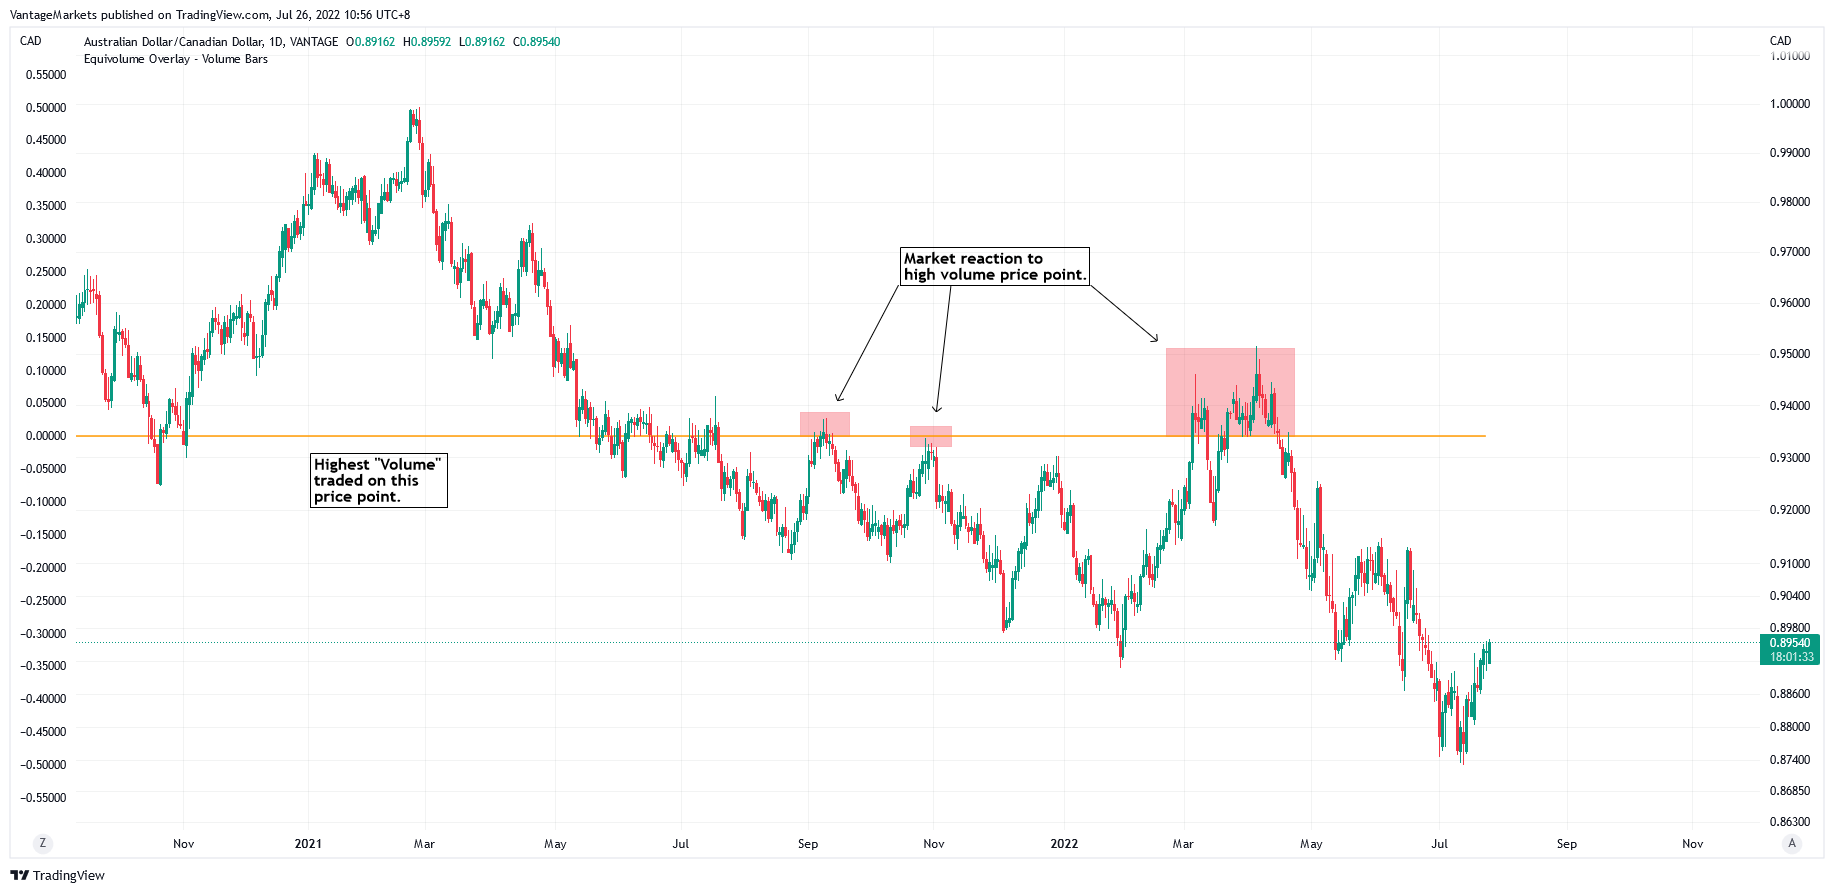
交易量的衡量标准也可以转化为给定时间范围内市场参与者的数量。这些信息对于关注交易量的交易者来说可能很有价值。然而,这个概念仅适用于股票交易。在外汇领域,交易量是通过一根柱线期间价格变化的次数来衡量的,人们认为它也衡量了投资者的活动[3]。 

  • 流行的成交量指标 = 成交量概况 

成交量剖面指标是一条显示特定时期内特定价格的交易量的水平线,近年来越来越受欢迎。 

图3 – AUDCAD D1 成交量曲线作为阻力 ( https://www.tradingview.com/x/fZKgrzMi/ ) 

自定义技术指标 

除了众所周知的指标外,还有独立编程的自定义指标。这些自定义指标遵循独特的数学计算来预测未来的价格变化。以下是创建自定义指标时需要遵循的一些基准: 

  • 确定指标类型 
  • 确定所需的组件 
  • 确定指标要遵循的规则集 
  • 回测和前测指标 

值得考虑的最佳自定义指标 

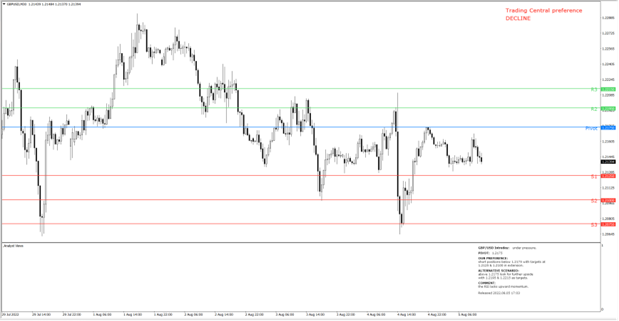
1. 分析师观点 – 分析师观点是基于屡获殊荣的市场方向和关键水平技术分析方法的自定义指标。交易者可以将分析交给专家团队,他们提供目标水平、枢轴点和替代目标。 

图 4 – 分析师对 MT4 的看法 

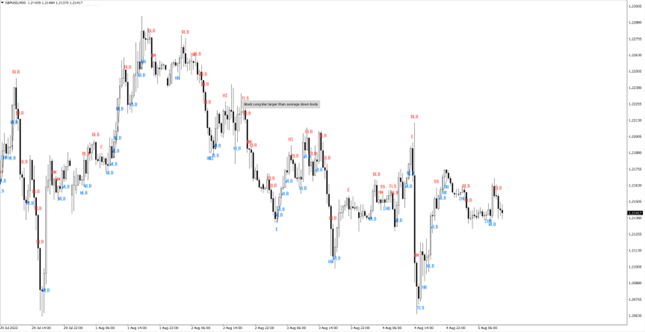
2. 自适应烛台 – 烛台模式说明了供给和需求的重要变化,自适应烛台可在任何图表上扫描 16 种值得信赖的烛台模式。独特的技术和定量分析相结合,帮助交易者根据当前情况做出决策。 

图 5 – MT4 上的自适应烛台 

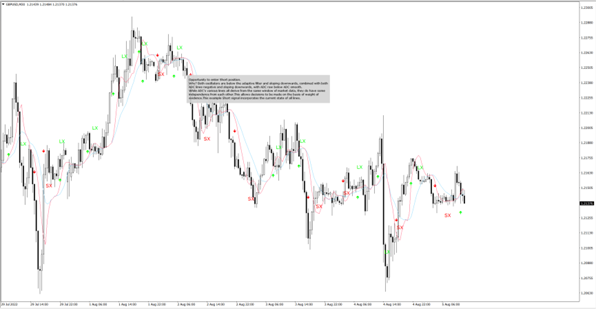
3. 自适应发散收敛 (ADC) – 对于短期交易,ADC 可替代 MACD。该指标提供及时的信号并避免盘整,使交易者能够获得进入和退出信号、慢速和快速价格指标、原始和平滑的信号线以及慢速和快速振荡器。 

图 6 – 自适应发散收敛 

想要使用这些自定义指标回测市场吗?当您注册实时 Vantage Markets 交易账户并充值至少 200 美元时,即可免费获得它们。条款和条件适用。 

最佳技术指标组合 

当指标与其他指标有效结合使用时,效果最佳。在上一部分中,它展示了可用指标的重要性和多样性。本部分将介绍一些经受时间考验的经典指标组合。一般来说,交易者将趋势指标与震荡指标结合起来制定基于指标的交易策略[4]。 

以下示例仅用于教育目的。过去的表现并不代表未来的结果,任何依赖此结果的风险均由您自行承担。 

1. 随机指标(振荡指标)+ 移动平均线(趋势指标) 

图 7 – GBPUSD H1 160 周期 SMA 和随机卖出示例 ( https://www.tradingview.com/x/Jb9zbuAi/ ) 

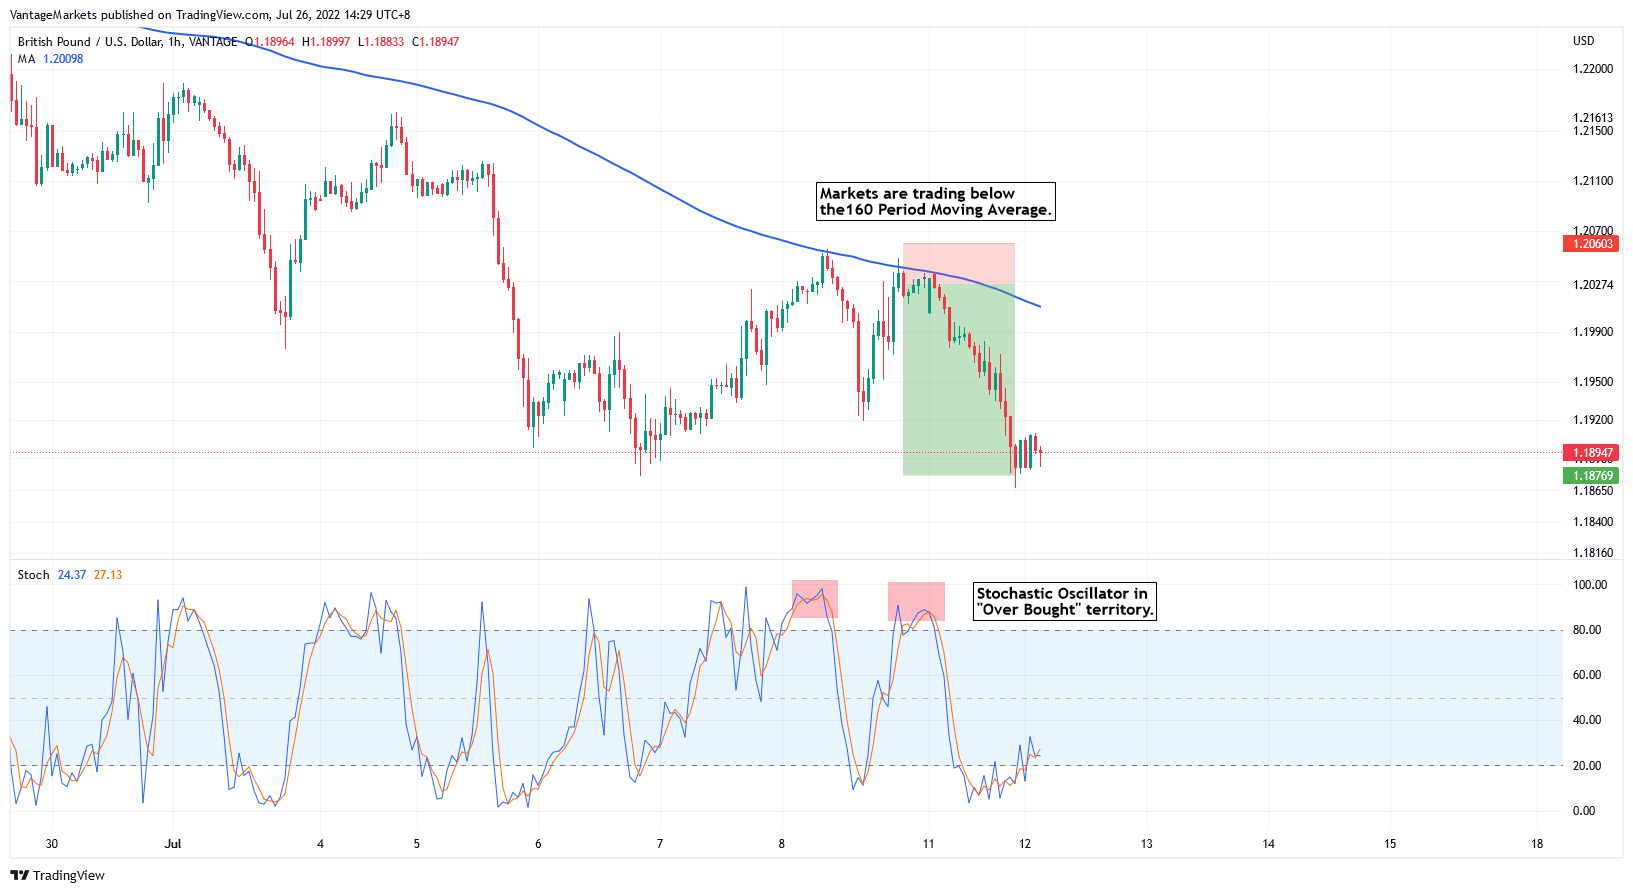
通过使用振荡器和趋势指标,产生的信息使交易者能够做出更加果断和自信的交易。在图 4 中,可以看到英镑兑美元交易低于 160 周期移动平均线,表明市场看跌,而随机振荡指标表明英镑兑美元处于“超买”市场状况,也预示着卖出。 

图 8 – EURUSD H4 160 周期 SMA 和随机指标买入示例 ( https://www.tradingview.com/x/Ja1OnpQ4/ ) 

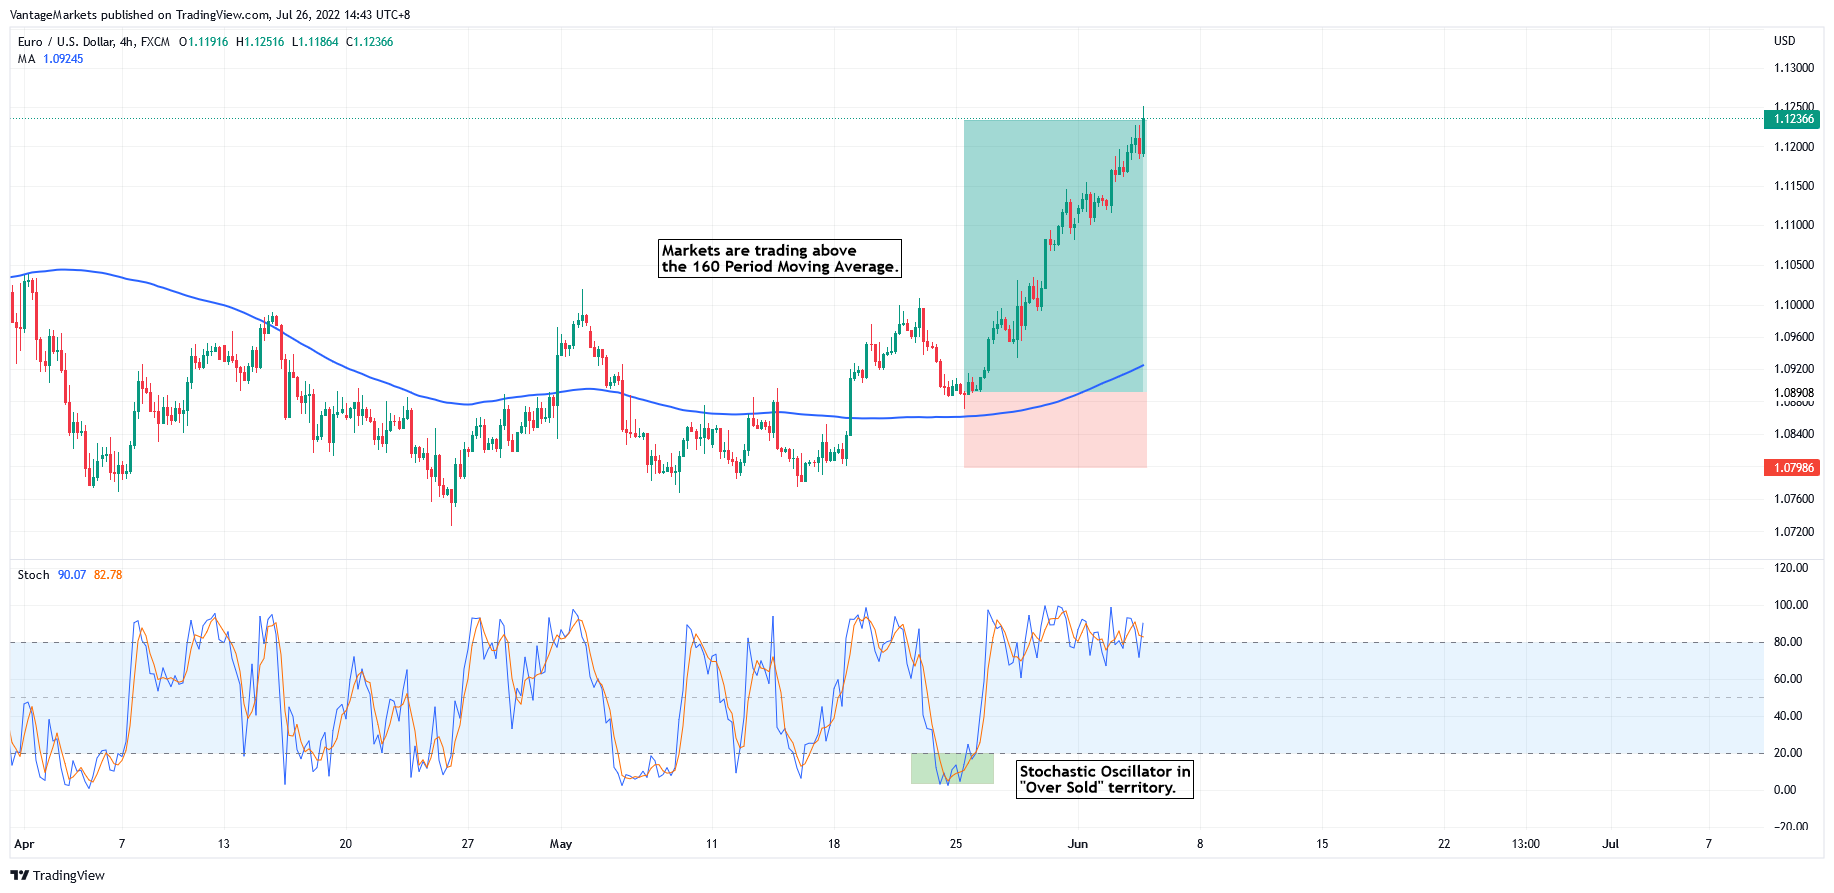
图 5 突出显示了移动平均线和随机买方示例。市场交易高于移动平均线且随机指标处于“超卖”区域,两者都指向看涨市场。 

2. MACD(振荡指标)+ 布林线(趋势) 

图 9 – XAUUSD D1 MACD 和布林带卖出示例 ( https://www.tradingview.com/x/PNfMb44J/ ) 

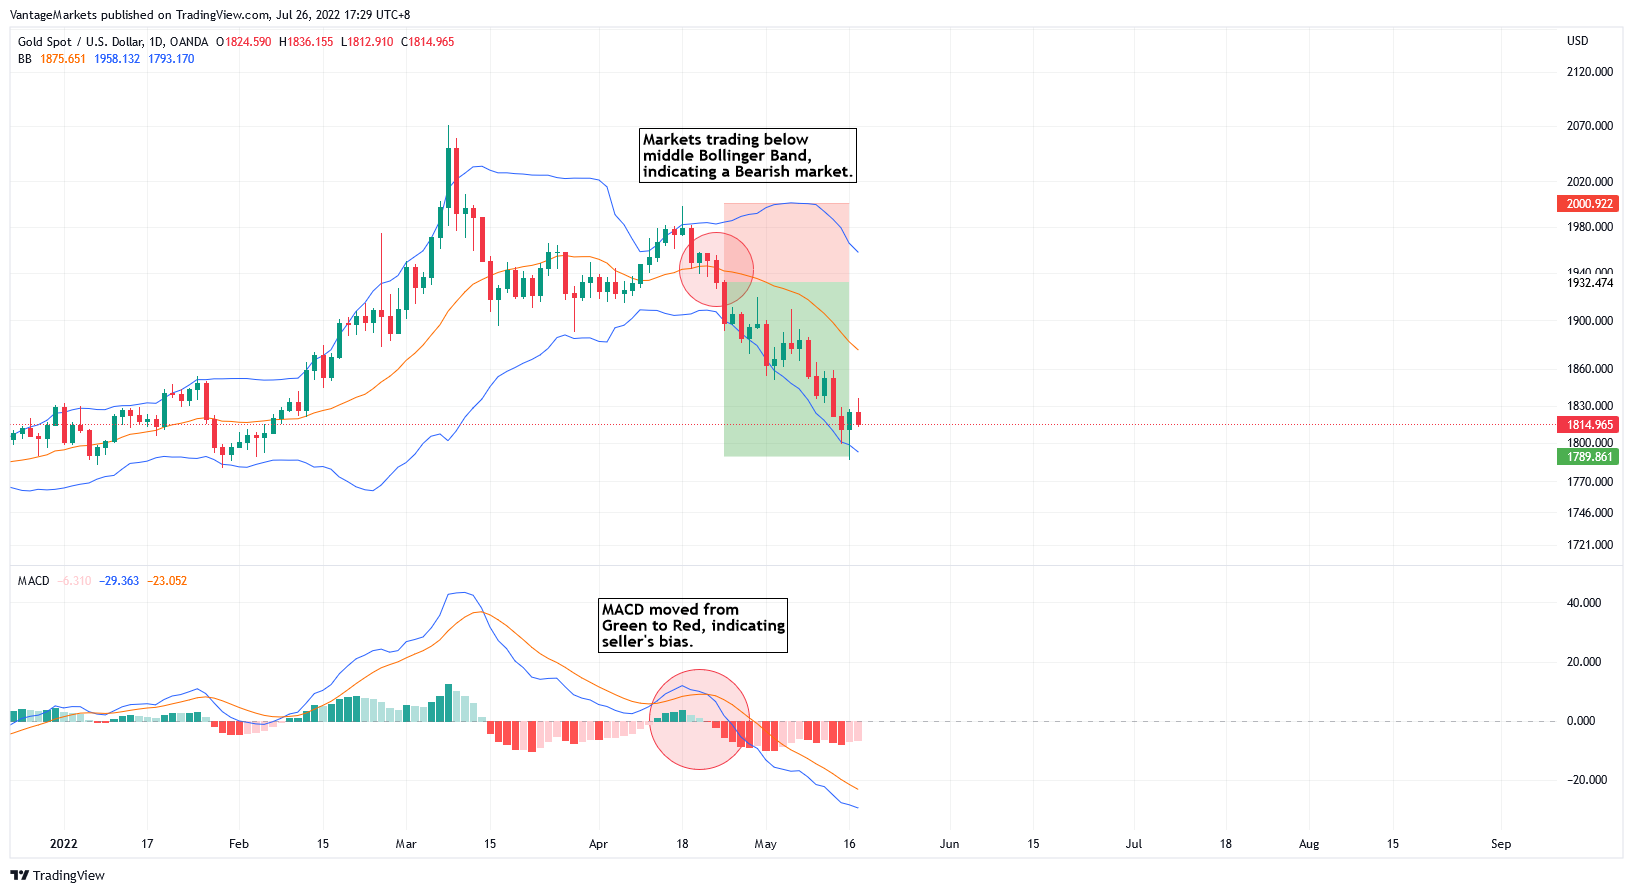
图 6 描绘了黄金市场的日线图,两个指标都指向看跌市场。 MACD 从绿色变为红色,这表明市场在布林线中线下方交易,表明卖出,表明市场可能开始看跌。 

图 10 – 美元日元 D1 MACD 和布林线买入示例 ( https://www.tradingview.com/x/HR0KA8AT/ ) 

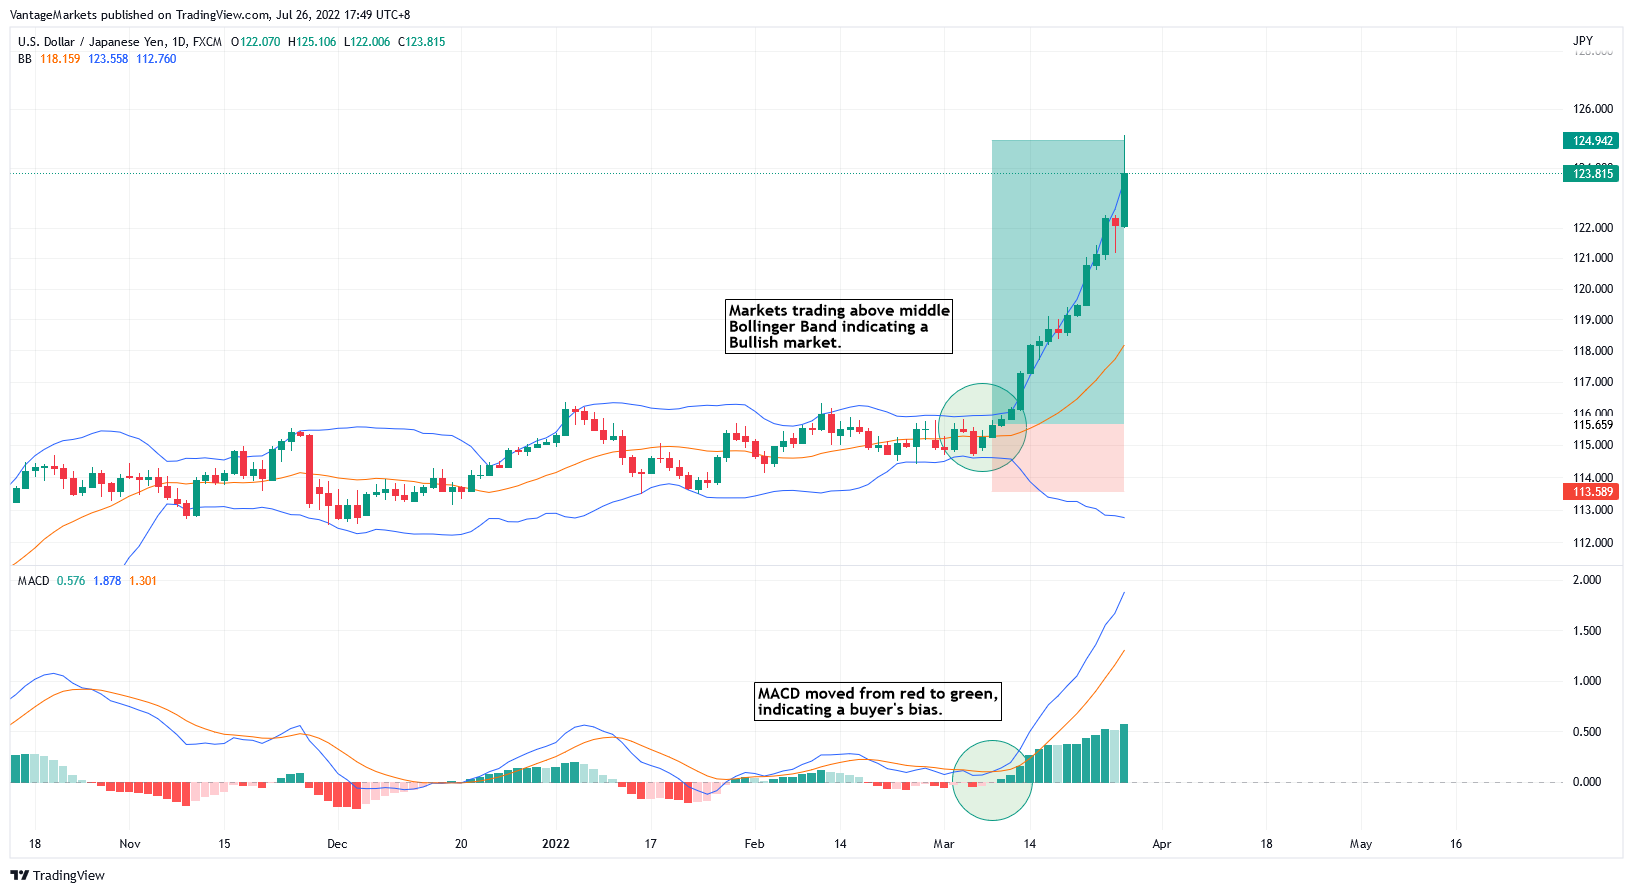
图 10 显示美元日元市场看涨,市场交易高于布林线中线且 MACD 从红色变为绿色表明了这一点。 

指标的可靠性 

尽管指标似乎是交易的圣杯,但您不会误会。使用指标的交易者常犯的一个错误是在图表上应用太多指标。这往往会导致“分析瘫痪”。太多的信息不一定是好事,所以请记住保持交易策略的重点。 

了解没有完美的指标将有助于减少对它们的过度依赖。许多交易者几乎所有的交易决策都是基于这些指标。请记住,还有其他形式的技术分析(例如价格行为)可以产生与指标相同的效率。 

想要找出哪种指标组合效果最好?尝试通过您自己的外汇模拟账户进行练习。 

参考资料

  1. “Moving Average (MA): Purpose, Uses, Formula, and Examples – Investopedia” https://www.investopedia.com/terms/m/movingaverage.asp Accessed21 Sept 2022.
  2. “Indicators for Overbought and Oversold Stocks – Investopedia” https://www.investopedia.com/ask/answers/121214/what-are-best-indicators-identify-overbought-and-oversold-stocks.asp Accessed 21 Sept 2022.
  3. “What are Volume Indicators (& How to Use Them) – BlueberryMarkets” https://blueberrymarkets.com/learn/intermediate/volume-indicators Accessed 21 Sept 2022.
  4. “6 Killer Combinations for Trading Strategies – FX Leaders” https://www.fxleaders.com/learn-forex/course/ch9-6-killer-combinations-for-trading-strategies/ Accessed 21 Sept 2022.

此信息旨在用于教育目的,仅构成一般信息。本公司不考虑任何人的具体投资目标、需求或财务状况,对所发布内容的准确性、完整性、适用性和及时性不作任何陈述,也不承担任何责任。上述“技术指标”不按任何顺序排列,并不旨在也不应被理解或解释为建议或做出任何具体投资决策的依据。依赖此类信息的风险完全由您自行承担,我们对因此类依赖而直接或间接导致的任何决策结果不承担任何责任。过去的表现并不代表未来的结果。 

  • vantage academy open account

    开放交易帐户

    通过我们的尖端平台发现无尽的交易可能性,旨在增强初学者和经验丰富的交易者的能力。今天,通过演示帐户将市场无风险交易的经验。

  • vantage academy app

    下载Vantage应用程序

    与Vantage Alt-On-All-One Trading应用程序进行交易,在您的手掌中,平稳的执行和市场获取融合在一起。

  • vantage academy start trading

    开始交易

    您是现有用户吗?登录到您的帐户,开始交易1,000多种产品,包括外汇,指数,黄金,股票等。