Important Information
You are visiting the international Vantage Markets website, distinct from the website operated by Vantage Global Prime LLP
( www.vantagemarkets.co.uk ) which is regulated by the Financial Conduct Authority ("FCA").
This website is managed by Vantage Markets' international entities, and it's important to emphasise that they are not subject to regulation by the FCA in the UK. Therefore, you must understand that you will not have the FCA’s protection when investing through this website – for example:
- You will not be guaranteed Negative Balance Protection
- You will not be protected by FCA’s leverage restrictions
- You will not have the right to settle disputes via the Financial Ombudsman Service (FOS)
- You will not be protected by Financial Services Compensation Scheme (FSCS)
- Any monies deposited will not be afforded the protection required under the FCA Client Assets Sourcebook. The level of protection for your funds will be determined by the regulations of the relevant local regulator.
If you would like to proceed and visit this website, you acknowledge and confirm the following:
- 1.The website is owned by Vantage Markets' international entities and not by Vantage Global Prime LLP, which is regulated by the FCA.
- 2.Vantage Global Limited, or any of the Vantage Markets international entities, are neither based in the UK nor licensed by the FCA.
- 3.You are accessing the website at your own initiative and have not been solicited by Vantage Global Limited in any way.
- 4.Investing through this website does not grant you the protections provided by the FCA.
- 5.Should you choose to invest through this website or with any of the international Vantage Markets entities, you will be subject to the rules and regulations of the relevant international regulatory authorities, not the FCA.
Vantage wants to make it clear that we are duly licensed and authorised to offer the services and financial derivative products listed on our website. Individuals accessing this website and registering a trading account do so entirely of their own volition and without prior solicitation.
By confirming your decision to proceed with entering the website, you hereby affirm that this decision was solely initiated by you, and no solicitation has been made by any Vantage entity.
I confirm my intention to proceed and enter this website Please direct me to the website operated by Vantage Global Prime LLP, regulated by the FCA in the United KingdomBy providing your email and proceeding to create an account on this website, you acknowledge that you will be opening an account with Vantage Global Limited, regulated by the Vanuatu Financial Services Commission (VFSC), and not the UK Financial Conduct Authority (FCA).
-
Please enter a valid email address
-
Please tick the checkbox to proceed
-
Please tick the checkbox to proceed
Please tick all to proceed
×
-
 REGISTER
  LOGIN
LOGIN-

View More
SEARCH
Keywords
- Forex Trading
- Vantage Rewards
- Trading Fees
Popular Search
- Trading Accounts
- MT4
- MT5
- TradingView
- Promotions
Thank you for your interest in viewing this course content. To continue, please fill in the form below.
![]()
xxxxxxxxxx
Please enter your name
xxxxxxxxxx
Please enter a valid email
Email is case sensitive.
Where did you hear about us ?
Please tick the checkbox to proceed
Demo Account Form
You are not an existing user. Please register to continue.
xxxxxxxxxx
Please enter your frist name
xxxxxxxxxx
Please enter your last name
xxxxxxxxxx
Please enter a valid email
xxxxxxxxxx
Please enter a valid country
No results found
xxxxxxxxxx
Please enter a valid province
No results found
xxxxxxxxxx
No results found
xxxxxxxxxx
Please enter your phone
Please tick the checkbox to proceed
Important
Vantage Global Limited does not accept applications from Australian residents.
Due to regulatory requirements, when you click 'continue' you will be redirected to the Australian website of Vantage, which is operated by Vantage Global Prime Pty Ltd - a company registered in Australia and regulated by the Australian Securities and Investments Commission (ASIC), AFSL no. 428901.
CONTINUEPlease wait
Error! Please try again.
![]()
Thank you
You can proceed and enjoy the course! You will be redirected shortly.

5.1 What is fundamental analysis?
Fundamental analysis is an important skill for anyone interested in investing. It is the practice of evaluating the fair value of a stock, based on concrete factors such as the financial situation of the underlying company, as well as macroeconomic realities and conditions.
When performed with skill, fundamental analysis can allow an investor or trader to establish whether the current share price is a fair and accurate representation of the true value of the stock.
This allows the investor to determine if a stock is overvalued or undervalued, and set appropriate price targets and strategies in response.
5.2 The basics of financial statements
When performing fundamental analysis, a core source of information is the company’s financial statements.
Publicly listed companies are required to publish financial statements, with quarterly and annual reports to be submitted by the end of the fiscal year. This is to allow the investing public and analysts to better evaluate a company’s performance and future prospects [1].
While financial statements can appear intimidating to those unfamiliar, there are only three core portions most investors need to pay attention to in order to get a good grasp of a stock’s intrinsic value – the income statement, balance sheet, and the cash flow statement.
Income statement
An income statement shows the revenue and expenses of a business over a specified duration, such as a fiscal quarter or year. It helps us understand the profitability of a business.
At the top of the income statement is listed the gross revenue, which is the total revenue earned during the accounting period. From this, the cost of goods sold (COGS) and other operating expenses are deducted, with the end result being the net income for the period.
A positive net income means the business is earning more than it spends, while a negative net income means the business is spending more than it earns.
Incidentally, the income statement is also known as the profit and loss statement; both terms may be used interchangeably.
Balance sheet
The balance sheet is made up of three main components – assets, liabilities and shareholders’ equity. In a healthy company, the total assets must be equal to the sum of total liabilities and shareholders’ equity.
If total assets are less than liabilities, this indicates asset deficiency – a sign that the company is in serious financial distress [2].
Assets listed in a balance sheet may include [3]:
- Cash and investments
- Accounts receivable
- Inventories
- Fixed assets such as property, plants or equipment
- Intangible assets such as copyright, intellectual properties, etc
Meanwhile, liabilities may include:
- Accounts payable
- Accrued expenses
- Debt
- Rent, taxes and utilities
- Wages payable
- Dividends payable
Since assets = liabilities + equity, shareholders’ equity is thus what’s leftover after the company pays off all its liabilities if liquidated [4].
Thus, shareholders’ equity is the dollar value of the company that would be returned to shareholders after debts are satisfied. High shareholders’ equity indicates the company is in good financial health, while weakness in this metric should warrant a cautious approach.
Cash flow statement
A cash-flow statement contains information about the inflows and outflows of a company’s cash during a specified time period. It commonly contains three sections – cash flow from operations, from investing, and from financing, reflecting the three main ways which companies generate cash.
Cash flow from operations is a section describing cash inflows and outflows stemming from business operating activities. It represents the company’s net income in cash terms, and may include buying and selling inventory and supplies, as well as employee salaries. Non-cash items such as dividends, debt and investments are not included in this calculation. .
Cash flow from investing activities contains results from investment gains and losses. It also records capital expenditure such as cash spent on fixed assets like property, plants and equipment.
And finally, cash flow from financing activities offers an overview of cash inflows and outflows between a company and its financiers. It may include events such as loan repayments, dividend payouts, and capital injections from fundraising efforts.
Putting the three financial statements together [5]
Here’s an overview of how these three financial statements differ, and how they work together to form a more complete picture of a company’s finances.
| Financial Statement | Key Features |
| Income statement | Measures revenue, expenses and profitability over a time period Indicates a company’s profitability |
| Balance sheet | Measures assets, liabilities and shareholders’ equity at a point on time Used as a gauge of a company’s financial position |
| Cash flow statement | Measures cash inflows and outflows over a time period Shows increase and decrease in cash from operations, investing and financing |
5.3 Key financial ratios to know
Financial ratios are helpful data points that facilitate investors in comparing one stock against its peers or industry benchmarks. They are derived from information found in a company’s financial statements, and are used as performance indicators.
Here are some key financial ratios investors should know. Note that no one single financial ratio can offer a complete picture of the company. Rather, each ratio focuses on a different aspect, and investors should become comfortable with using several financial ratios in conjunction instead of simply relying on a few.
Price-to-Earnings (P/E) [6]
The Price-to-Earnings ratio measures the share price of a company against its Earnings-per-Share (EPS). It is commonly used as a valuation tool, providing insights into how the market values a company’s earnings, and may also be known as the price multiple or earnings multiple.
Essentially, the P/E ratio shows the dollar amount an investor needs to invest to receive $1 of that company’s earnings. Hence, it can be used to compare different stocks, or track the performance of a stock throughout time.
A high P/E ratio may indicate the stock is overvalued. Meanwhile, a low P/E ratio may mean the stock is undervalued, or it has recently done well compared to past periods.
The formula for calculating P/E ratio is:
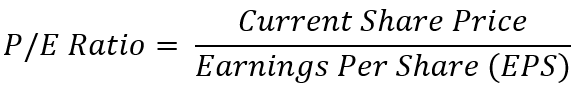
Note that EPS is a figure that can be trailing (backward looking) or projected (forward looking), resulting in two forms of P/E – trailing P/E and forward P/E.
Trailing P/E is used when describing current performance, while forward P/E may be deployed in a stock forecast.
Price/Earnings-to-Growth (PEG) [7]
Price/Earnings-to-Growth (PEG) is akin to P/E ratio in that both are used as stock valuation tools. However, PEG is regarded as a fuller and more accurate measure, as it takes into account the projected future growth of the company.
The formula for PEG is:
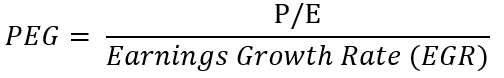
Note that EGR is the expected earnings growth rate of the company over the next five years, making PEG a forward-looking metric.
EGR longer than five years may be used, but note that growth projections become less accurate the farther out they go.
Price-to-Sales (P/S) [8]
To calculate P/E and PEG, the company must have earnings.
When a company does not have earnings yet (such as startups that are not yet profitable, or highly cyclical stocks where earnings are not always produced), the Price-to-Sales ratio may be used instead for stock valuation.
The formula for calculating P/S is:
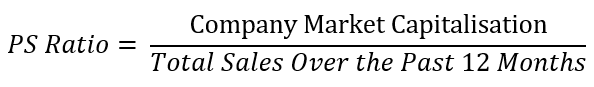
P/S ratio that is around 1.0 shows the company’s share price is on par with its earnings. Readings less than 1.0 is better may indicate that the stock is undervalued, while readings more than 1.0 likely means the stock is expensive or overvalued.
When comparing P/S between two stocks, the one with the lower P/S is considered more attractive, especially if the other stock is significantly higher than the industry or sector’s average P/S.
Price-to-Book (P/B) [9]
The Price-to-Book ratio (P/B) measures how well a stock is trading in line with the book value of the company. This is a popular ratio that is useful for finding undervalued companies.
The formula for calculating P/B is:
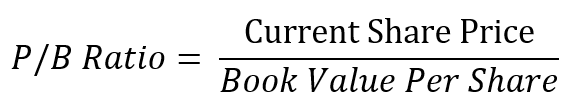
Book value per share = (Total assets – intangible assets – total liabilities) divided by number of outstanding shares.
Similar to P/S, a P/B close to 1.0 indicates the stock is trading in line with the book value of the company. Stocks with P/B lower than 1.0 are regarded as undervalued, and those with P/B higher than 1.0 are considered to be trading at a premium.
Due to limitations, P/B should only be used to compare stocks in the same sector.
Debt-to-Equity (D/E) [10]
The Debt-to-Equity ratio shows how much debt a company is using to finance its operations. Taking on too high levels of debt can be problematic, as debt needs to be paid off with interest, placing pressure on the company’s bottomline.
D/E is calculated using the formula:
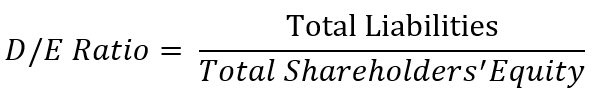
By comparing D/E between companies, the one with a higher D/E may pose a riskier investment, while the one with a lower D/E may have lower risk. To be accurate, D/E should be taken within the context of industry norms, as well as in consideration of company requirements (growth stocks may require higher debt than mature companies, for example).
5.4 Dividend yield and payout ratio
Dividend stocks (see Module 2) offer payouts to shareholders at fixed intervals, making them popular among passive income-seeking investors.
It is important to understand how dividends can impact the company giving them out, and what the dividend yield means.
Dividend yield [11]
Dividend yield is calculated using:

Contrary to popular belief, a higher dividend yield doesn’t necessarily mean a higher payout. To understand why, consider these two companies:
| Company | FY 2021 | FY 2022 |
| ABC Corp | Share price: USD 20 Dividend payout: USD 1 Dividend yield: 5% | Share price: USD 18 Dividend payout: USD 1 Dividend yield: 5.5% |
| MNC Inc | Share price: USD 30 Dividend payout: USD 1.50 Dividend yield: 5% | Share price: USD 38 Dividend payout: USD 1.80 Dividend yield: 4.74% |
ABC Corp increased its dividend yield from 5% to 5.5%, but its payout in dollar terms remained the same at USD 1 per share. This is because the company’s share price fell by 10%.
In contrast, dividend yield for MNC Inc fell from 5% to 4.7%. However, investors actually received a higher sum per share. This is because the company’s share price increased by around 27%
This brings us to the second piece of the puzzle necessary when evaluating a dividend stock – the dividend payout ratio.
Dividend payout ratio [12]
Dividends are paid out from the profits a company makes. Allocating a bigger portion of profits as dividends will result in larger payouts to investors, but this also means the company retains less profits.
This may not be good for the company, especially over the long run. It could indicate that management is less interested in continuing to grow the company, and may be attempting to use high dividend payouts to maintain investor interest.
Generally, only well-established companies commanding market-leading positions are able to afford dividend payout ratios in the higher range, around 50% to 55% of total profits.
Meanwhile, smaller companies may pay out around 35% of their profits and still remain healthy. Very young companies should reinvest most or all of their profits for future growth, instead of attempting to pay dividends to investors.
5.5 Earnings reports and how they impact stock prices [13]
One of the major movers of stock prices are earnings reports. When publicly listed companies release their earnings every quarter, there is a solid chance for significant stock price movements.
Curiously, stock prices may sometimes move in logic-defying directions. Even if a company meets – or exceeds – expectations, share prices may remain flat, or even fall.
Planning investments around earnings releases can be risky, due to the following factors.
High P/E ratio
If a stock has a high P/E ratio, investors may expect a high growth rate in return. Should the company fail to deliver a sufficiently high growth rate, investors may believe the stock is no longer worth the premium on the share price, and sell their holdings.
Thus, even if the company achieves a good rate, its share price may still be at risk of falling if its P/E ratio is at a high level.
High revenue expectations
Analysts expectations, if not met, can also cause a dip in share price. Of course, analyst forecasts are not infallible, and it can be easy to set overly high expectations.
Despite this, missing analysts estimates for revenue and earnings can be enough to bring a stock down – even if the company achieved objectively decent results.
Management guidance
It is customary for companies to offer predictions for future earnings reports. This is known as guidance, and can also impact share prices.
For example, in Q1 2023, despite beating market estimates, CVS saw its stock fall by 3%. This was believed to be due to management guidance cutting its earnings forecast for the year.
The reduction had put the company’s forecast lower than previous analysts’ expectations, causing investors to retreat.
5.6 Other events that impact stock prices
Company mergers or acquisitions [14]
It has been observed that during a merger or acquisition, the stock prices of both companies tend to move in opposite directions over the short term. Share prices of the acquiring company falls slightly, while share prices of the target company rises.
This is because the acquiring company has to increase its debt liabilities or use up its cash reserves to finance the acquisition. It may also have to pay a premium to entice the target company’s shareholders to agree to the takeover.
In turn, this can prompt a rise in the share price of the target company. Share prices may also increase because an acquisition may be read as a sign of confidence in the target company’s long-term growth prospects.
Company news
Company news and announcements can have a positive or negative impact on share prices.
For example, Netflix announced plans to increase its subscription prices after achieving USD 8,8 billion in revenue for Q3 2023. The news inspired a 12% spike in the company’s share prices during after-hours trading, even though prices closed down by over 2% after earnings [15].
Company management antics
The senior management of a company can be highly influential, and their actions can create volatility in share prices.
Perhaps the most well-known example is Elon Musk, who was brought to trial over a tweet he made in 2018, hinting at taking Tesla private at USD 420 a share, and that funding had been secured. This caused a rally in Tesla’s stock that failed to maintain its momentum, with share price ultimately falling below pre-tweet levels.
Investors who lost money due to Musk’s tweet brought a class action lawsuit, resulting in a three-week long trial in San Francisco in which Musk was found not guilty [16].
Data releases
Share prices can also be affected by the release of key economic data.
For instance, high inflation levels cause central banks to raise interest rates as a cooling measure. This raises the cost of borrowing, which puts companies reliant on debt at greater risk. Stock prices of such companies may drop, as shareholders cut holdings in expectation of rate hikes.
Conversely, high GDP, strong labour market and other markers of healthy economic growth can raise demand for stocks. Share prices are bidded upwards as more investors enter the market, and buy up stocks of well-performing or promising companies.
It appears that this quiz is not set up correctlyModule recap
- Fundamental analysis is the practice of evaluating the fair value of a stock, based on the financial situation of the underlying company, as well as macroeconomic realities and conditions.
- Financial statements are a key source of information and data in fundamental analysis. Investors should be familiar with the income statement, the balance sheet, and the cash flow statement.
- The income statement shows the revenue and expenses of a business over a fiscal quarter or year. It helps us understand the profitability of a business.
- The balance sheet displays the company’s assets, liabilities and shareholders’ equity. Assets must equal the sum of liabilities and equity.
- The cash-flow statement details the inflows and outflows of a company’s cash during a specified time period, split up over cash flow from operations; from investing; and from financing.
- Financial ratios are performance indicators that allow investors to compare stocks against their peers or the overall sector.
- Key financial ratios include
- Price-to-Earnings (P/E), which measures how much to invest to receive S$1 of earnings
- Price/Earnings-to-Growth (PEG), which expands upon P/E by taking into account the projected future growth of the company
- Price-to-Sales (P/S), used for stock valuation when earnings data are not available
- Price-to-Book ratio (P/B), a measure of how well a stock is trading in line with the book value of the company
- Debt-to-Equity (D/E), which shows much debt a company is using to finance its operations
- When evaluating dividend stocks, pay attention to dividend payout ratio to ensure the sufficient profits are being reinvested for further growth. High dividend yields may not always be positive, as they may be caused by a drop in share prices.
- Earnings reports can impact share prices. Three common factors to watch for are high P/E ratio, high expectations, and management guidance.
- Besides earning reports, external events and factors can also cause stock prices to rise or fall.
- Company mergers can increase the share price of the target company, while reducing the share price of the acquiring company. This is often short-term.
- The actions and antics of senior management can also cause volatility in share prices. One famous example is Elon Musk’s tweet about taking Tesla private, which resulted in a class action lawsuit from affected investors.
- Economic data releases can also affect the stock market. A poor outlook can cause share prices to fall, while strong results can inspire demand for stocks.
Reference:
- “When Must a Company Announce Earnings? – Investopedia” https://www.investopedia.com/ask/answers/04/050604.asp Accessed 28 Dec 2023
- “Asset Deficiency: What it is, How it Works, Example – Investopedia” https://www.investopedia.com/terms/a/asset-deficiency.asp Accessed 28 Dec 2023
- “How Do the Income Statement and Balance Sheet Differ? – Investopedia” https://www.investopedia.com/ask/answers/101314/what-difference-between-income-statement-and-balance-sheet.asp Accessed 28 Dec 2023
- “What Is Shareholder Equity (SE) and How Is It Calculated? – Investopedia” https://www.investopedia.com/terms/s/shareholdersequity.asp Accessed 28 Dec 2023
- “Three Financial Statements – CFI” https://corporatefinanceinstitute.com/resources/accounting/three-financial-statements/ Accessed 28 Dec 2023
- “Price/Earnings-to-Growth (PEG) Ratio: What It Is and the Formula – Investopedia” https://www.investopedia.com/terms/p/pegratio.asp Accessed 28 Dec 2023
- “What Is a Good PEG Ratio For A Stock? PEG Ratio Defined – Investopedia” https://www.investopedia.com/terms/p/pegratio.asp Accessed 28 Dec 2023
- “How to Use Price-To-Sales Ratios to Value Stocks – Investopedia” https://www.investopedia.com/articles/fundamental/03/032603.asp Accessed 28 Dec 2023
- “Using the Price-to-Book (P/B) Ratio to Evaluate Companies – Investopedia” https://www.investopedia.com/investing/using-price-to-book-ratio-evaluate-companies/ Accessed 28 Dec 2023
- “6 Basic Financial Ratios and What They Reveal – Investopedia” https://www.investopedia.com/financial-edge/0910/6-basic-financial-ratios-and-what-they-tell-you.aspx Accessed 28 Dec 2023
- “Dividend Yield: Meaning, Formula, Example, and Pros and Cons – Investopedia” https://www.investopedia.com/terms/d/dividendyield.asp Accessed 28 Dec 2023
- “What Is an Ideal Payout Ratio? – Dividend.com” https://www.dividend.com/dividend-education/what-is-an-ideal-payout-ratio/ Accessed 28 Dec 2023
- “How Stock Prices Correlate With Quarterly Earnings and When You Should Buy – Nasdaq” https://www.nasdaq.com/articles/how-stock-prices-correlate-with-quarterly-earnings-and-when-you-should-buy Accessed 28 Dec 2023
- “How Company Stocks Move During an Acquisition – Investopedia” https://www.investopedia.com/ask/answers/203.asp Accessed 28 Dec 2023
- “Netflix Hikes Prices For Some Plans As Subscriber Numbers Surge – Forbes” https://www.forbes.com/sites/antoniopequenoiv/2023/10/18/netflix-hikes-prices-for-some-plans-as-subscriber-numbers-surge/?sh=549f043b56e0 Accessed 28 Dec 2023
- “Elon Musk wins lawsuit over ‘funding secured’ tweet – CNN” https://edition.cnn.com/2023/02/03/cars/musk-tesla-tweet-lawsuit-jury/index.html Accessed 28 Dec 2023
Previous Lesson
Next Lesson