A look at global indices in 2024 so far
Recent developments in global stock markets have witnessed unprecedented heights, transcending the traditional dominance of United States indices, characterised by their reliance on a select group of large-capitalisation companies. Notably, the remarkable performance of Nvidia, a leading semiconductor manufacturer, has significantly propelled the valuations of technology stocks, thereby catalysing a broader surge in equity markets worldwide. This surge is exemplified by the record levels Germany’s DAX and Japan’s Nikkei 225 have been trading at.
Investors are currently adopting a forward-looking perspective, seemingly undeterred by the prevailing high interest rate environment. There is a prevailing anticipation that borrowing costs will decrease in the later part of the year, despite potential delays. This optimism is underpinned by the robustness of the United States economy and the prospect of a ‘soft landing’. Furthermore, the ongoing technological revolution, coupled with signs of overvaluation in certain sectors and companies, presents a conducive environment for stock indices to achieve new milestones.
The sustainability of these market levels remains a critical consideration for traders. With the majority of the earnings reports for the fourth quarter now public, there is an observable trend towards an improvement in profitability, which provides a degree of justification for the currently elevated market valuations. However, it is important to acknowledge that market exuberance can drive prices to levels far beyond intrinsic values, as investors increasingly participate in the rally.
It is also noteworthy that historically, high interest rates have posed challenges for growth-oriented stocks. Additionally, from a technical analysis standpoint, various stock indices are currently signalling overbought conditions across multiple timeframes, as indicated by momentum indicators. This scenario presents a complex landscape for investors, blending elements of optimism with caution.
Key Points
- Global stock markets reach unprecedented heights, driven by tech giants like Nvidia and broader economic optimism despite high interest rates.
- The robustness of the US economy and technological innovations contribute to market strength, yet overvaluation concerns and high interest rates pose challenges.
- Diversification and long-term investment strategies are recommended in a complex investment landscape marked by both euphoria and caution.
Understanding Stock Market Indices
When individuals refer to “markets” in common discourse, they are often alluding to stock indices. Indices such as the Dow Jones Industrial Average, the Nasdaq Composite, and the DAX are now ingrained in everyday vernacular, despite a general lack of detailed understanding about these financial barometers.
These collections of stocks serve as a prominent indicator of a country’s economic health and prosperity. Additionally, they play a pivotal role in shaping market sentiment, encompassing some of the most globally recognised corporations that are frequently included in individual investment portfolios and retirement savings.
The principal stock market indices are as follows:
- DJ30 (Dow Jones Industrial Average): This index represents the stock performance of the 30 leading blue-chip companies in the United States. Established by Charles Dow in May 1896 in its initial version, the DJ30 adopts a price-weighting methodology, contrasting with other indices that utilise market capitalisation for weighting.
- Nasdaq 100: As a more contemporary index, the Nasdaq 100 encapsulates the market capitalisation of the top 100 non-financial corporations in the U.S. It is heavily weighted towards technology firms, featuring prominent entities such as Apple and Microsoft.
- S&P 500: This index comprises 500 large-cap US companies and is regarded as the quintessential benchmark for blue-chip stocks within stock market indices.
- DAX 40: The DAX (Deutscher Aktienindex) 40 tracks the performance of the top 40 companies listed on the Frankfurt Stock Exchange, although historically it was known to track 30 companies. This adjustment reflects the evolving nature of the index and its role in representing Germany’s corporate landscape.
- Nikkei 225: The Nikkei 225 is a stock market index for the Tokyo Stock Exchange (TSE). It is a price-weighted index, similar to the DJ30, and tracks the performance of 225 top-rated companies listed on the TSE.

Chart 1: Price chart for DJ30, Nasdaq 100, S&P 500, DAX 40 and Nikkei 225 from 1 Jan 2023 – 16 July 2024. (https://www.tradingview.com/x/BlZJ2Tps/)
These indices collectively offer a comprehensive overview of the financial health and trends within the world’s leading economies, serving as essential tools for investors and analysts alike.
Sign up for a live account with Vantage today and trade Indices CFDs. Our platform provides the opportunity for you to execute trades in both market directions with the option to go long in anticipation of market gains or to opt for short selling in response to potential market downturns.
Markets Surge to New Heights Amid Broad-Based Rally [1,2,3,4,5]
The attempted assassination of presidential candidate Donald Trump during a campaign rally in Pennsylvania on 13 July 2024 couldn’t knock US stocks from record levels.
Instead, the S&P 500 gained 0.3%, and the Nasdaq Composite added 0.4%. This rise was contributed to by shares of electric vehicle maker Tesla (NASDAQ: TSLA), which ended 1.8% higher after billionaire CEO Elon Musk publicly endorsed Donald Trump following the shooting.
The S&P 500 then continued its upward trajectory, rising by 0.6% to close at 5,667.20 on 16 July 2024, marking its 38th all-time high this year. Unlike other record-setting days, this rally saw nearly 90% of the stocks in the index gain, moving beyond the typical dominance of major tech firms.
This broad-based advance was bolstered by strong earnings reports from companies like UnitedHealth Group and Bank of America, which helped mitigate declines in large tech stocks like Nvidia, despite its recent significant gains fueled by AI technology excitement. Nvidia shares are still up 155.2% for the year so far.
This market resilience has fueled trader confidence that the Federal Reserve might start reducing interest rates as early as September. Current predictions are overwhelmingly confident, with a 93.3% likelihood of a rate cut to between 5% and 5.25%, and a 6.7% chance of a further reduction to below 5%.
This optimism follows the latest consumer price index update for June, showing a 0.1% decrease from the prior month and bringing the annual inflation rate to its lowest in three years at 3%.
The expansion of the bullish trend in the United States is mirrored in Japan, Europe, and India. In Europe, a select group of powerhouse companies has been pivotal in driving their respective indices upwards. A mere 11 corporations, humorously termed the “Granolas” by Goldman Sachs, were responsible for half of the market’s overall elevation over the past 12 months.
Concurrently, Japan has achieved its first new record high since 1989, the birth year of Taylor Swift, thanks to the “Seven Samurais”. This achievement is attributed to an ultra-accommodative monetary policy, a depreciating yen, and extensive corporate reforms that are now beginning to pay off.
The Path to Record Highs
The ascension of major technology corporations has significantly propelled United States stock indices to unparalleled heights. The group colloquially termed the “Magnificent 7” has been instrumental, contributing to 60% of the S&P 500’s remarkable 25% or more in 2023, buoyed by the burgeoning enthusiasm for artificial intelligence [1,2].
This momentum has sustained into the current year, with Nvidia at the forefront. Following its exceptional financial disclosures, Nvidia witnessed an addition of nearly $280 billion to its market valuation within a single day, setting a new record for the largest gain by any company in history and surpassing the prior record of $196 billion set by Meta a few weeks earlier [3].

Chart 2: Nvidia price chart and market capitalisation from January 2023 to 16 July 2024 (https://www.tradingview.com/x/B04QVOGN/)
The reality that several of these entities have reached trillion-dollar valuations in recent times renders substantial daily fluctuations in market value, amounting to hundreds of billions of dollars, increasingly plausible. Consequently, this phenomenon significantly influences market-capitalisation weighted indices, thereby amplifying concerns regarding the limited scope of market advancements. By certain metrics, the stock market’s concentration has been at its zenith since the 1970s.
Indicators of a Bull Market
A bull market is characterised by a sustained increase in market prices, typically defined by a period during which the majority of investors engage in purchasing activities, leading to a scenario where demand surpasses supply and market confidence reaches a zenith.
This escalation in investor optimism fosters a positive feedback loop, thereby attracting additional investment and propelling a further appreciation in asset prices. Such market conditions are frequently associated with a robust economic environment, marked by an expanding Gross Domestic Product (GDP) and elevated employment levels.
In terms of market valuations, the S&P 500 is presently trading at a price-earnings ratio—a widely utilised metric for stock valuation—of approximately 20. This valuation mirrors levels previously observed in February 2022 and significantly exceeds the historical average of 15.7.
It is important to acknowledge that this valuation metric is disproportionately influenced by the largest constituents within the index. The collective known as the “Magnificent 7” accounts for approximately 29% of the index’s overall weighting and trades at an average price-earnings ratio of 34 times earnings[4]. Despite this, the broader index valuations are deemed not to be excessively inflated and remain well below the peak price-earnings ratio of 28 observed during the zenith of the Y2K bubble.
External Factors Influencing Market Performance
A scenario described as a ‘soft landing’, characterised by robust economic growth, moderate inflation, and a relaxation in monetary policy, has created an optimal environment for equity markets.
Economic indicators have consistently surpassed expectations, facilitating an expansion in market valuations and allowing earnings growth to exceed its customary pace. The easing of inflationary pressures has played a pivotal role, despite persisting challenges in certain sectors, with both consensus forecasts and projections from the Federal Reserve indicating a sustainable trajectory towards achieving a 2% inflation target.
Investor confidence has undoubtedly been bolstered by the burgeoning interest in artificial intelligence (AI) and what has been termed the “transformational tech trend”. The influence of AI, from its enablers to the emerging adopters, is profoundly significant, offering substantial improvements in efficiency and productivity.
However, comparisons are increasingly being drawn between the current market dynamics and the dotcom bubble of 2000, with Nvidia’s situation being likened to that of Cisco’s dramatic decline from $78 to $11 between March 2000 and September 2001 [5].
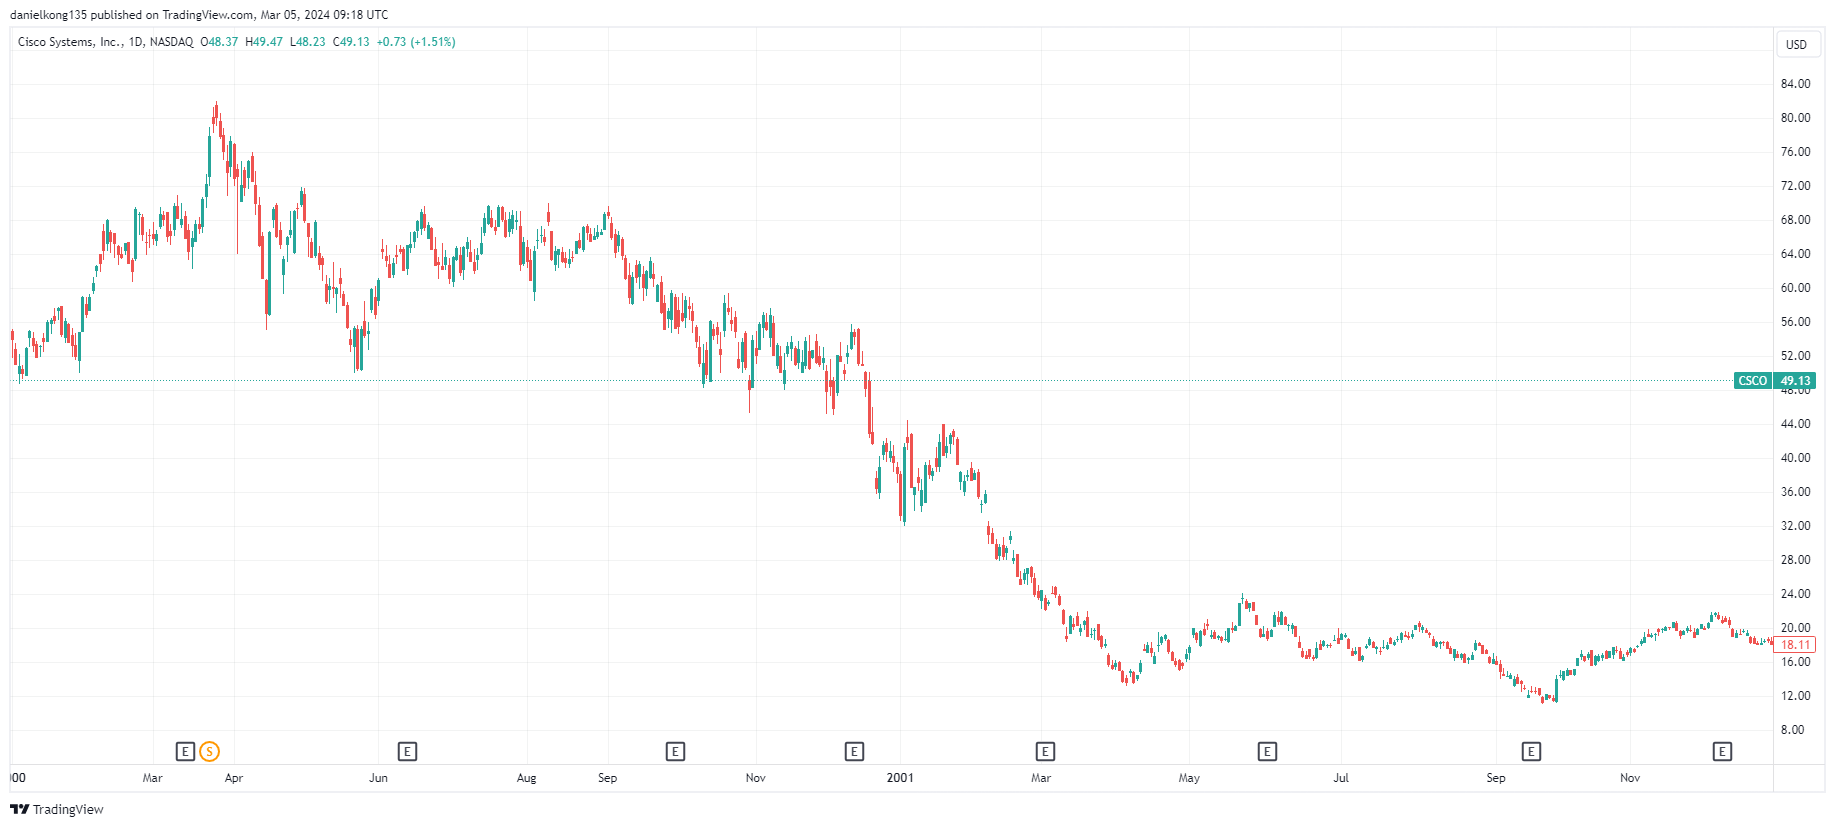
Chart 3: Cisco price chart from January 2000 to December 2001 (https://www.tradingview.com/x/RJxsEHEg/)
Despite these parallels, there is a consensus that the market has not yet reached a level of euphoria comparable to that era. This is attributed to the relatively low participation of retail investors in equity markets and the continued impact of central bank monetary expansion, even as prices have shown resilience in the face of adverse news and other high-risk assets have begun to experience significant gains.
Challenges and Risks Ahead
Potential hazards and obstacles that could impede the current upward trajectory of the market encompass apprehensions regarding inflation and a substantial alteration in fiscal policy.
The Federal Reserve has issued warnings that a decisive assurance of the mitigation of inflationary pressures is requisite prior to any reduction in interest rates. The forthcoming economic data will play a crucial role. A resurgence in inflation could precipitate a more drastic recalibration of expectations than previously observed, resulting in a scenario where interest rates remain elevated for an extended duration.
Elevated interest rates pose a particular threat to technology companies characterised by lofty valuations predicated on anticipated future earnings. This is attributable to the diminished present value of earnings projected for the future. Conversely, the adverse effects of heightened interest rates may eventually manifest in the broader economy, curtailing consumer and business activity, decelerating growth, and potentially precipitating a recession.
Geopolitical tensions also present a clear risk, with ongoing conflicts in Ukraine and the Middle East, alongside escalating frictions between China and the United States, particularly with some prognostications suggesting these tensions could culminate in Taiwan. The approach to the United States election could intensify these tensions as presidential candidates vie to surpass one another in their anti-China rhetoric. A trade war or other form of conflict would undoubtedly attenuate the current rally in risk assets.
Diverging Opinions Among Economists and Analysts
Some analysts posit that the current upward trajectory of the stock market may evolve into a more exuberant bubble, often precipitated by the anticipation of a revolutionary breakthrough, accompanied by overvaluation and a neglect of fundamental financial metrics.
The bubble experienced in 1999 serves as a precedent for such phenomena, and there is speculation that, a quarter-century later, the market may be on the cusp of a similar occurrence. Notably, there has been the introduction of novel valuation metrics, such as the “price to innovation” ratio, proposed as a contemporary alternative to the traditional price to earnings ratio, which is perceived as becoming obsolete.
Investors may begin to overlook adverse news as the fervour escalates. The concept of FOMO (Fear of Missing Out) has once again become prominent in financial discourse, indicating a significant shift in investor behaviour and sentiment. Indeed, it has been suggested in a recent note from an investment bank that this sentiment has surpassed the Federal Open Market Committee (FOMC) in terms of its influence on market dynamics.
Furthermore, there is apprehension among other market observers that the current “Goldilocks” economic scenario—characterised by a balance not too inflationary nor too deflationary—may devolve into a period of stagflation. This term refers to a challenging economic condition marked by both stagnation and high inflation, with rising consumer prices and increased unemployment as the economy declines.
Under such circumstances, interest rates may need to remain elevated for an extended period, potentially exerting a negative impact on stock valuations.
Strategies for Investors
Maintaining a diversified investment portfolio, underpinned by judicious risk management principles, is invariably advisable. Concentrating one’s financial resources too heavily in a single asset class or market sector can appear advantageous during certain periods. However, the performance of such a narrowly focused portfolio can deteriorate rapidly in the face of market shocks or the emergence of unforeseen news.
In essence, diversification serves to mitigate the volatility and potential risk to which investors are exposed. It is crucial to distinguish between volatility and risk; while the stock market embodies inherent volatility, with prices fluctuating over short periods, it does not necessarily constitute a high-risk environment for those committed to long-term investment strategies.
Moreover, sustained participation in the market remains critical, even amidst periods when stock indices are consistently setting new records.
An analysis conducted by UBS, the investment banking firm, reveals that the S&P 500 has operated within a 5% margin of its record high approximately 60% of the time [6]. Conversely, it has found itself more than 20% below its most recent peak only 12% of the time. This data suggests that entering the market when it is proximate to achieving a new high is not an uncommon occurrence but rather a frequent aspect of investing based on the historical behaviour of the S&P 500.
Conclusion
The attainment of unprecedented highs in global stock markets represents a juncture of both “euphoria and astonishment,” as articulated by a market participant, particularly when Japan’s Nikkei 225 index surpassed its multi-decade high. It is undeniable that investors and financial markets are inherently anticipatory, with emerging indicators of a more favourable global economic climate, characterised by stabilising growth and well-managed inflation rates.
Nonetheless, the dominance of a select few corporations in propelling the major stock indices upwards has traditionally not been indicative of a robust market environment, although the validity of market breadth as an indicator remains a subject of debate.
In the prevailing economic context, characterised by both risks and potential rewards, exercising caution and investing only disposable capital is advisable, especially as markets reach their zenith. Factors such as market sentiment, valuation metrics, future interest rate expectations, and earnings growth prospects constitute integral elements of the broader economic panorama. Historical analysis further reveals that stock indices have spent a considerable amount of time at record highs, more frequently than commonly perceived.
References
- “Stock market today: Asian stocks slip, while Australian index tracks Wall St rally to hit record – ABC News” https://abcnews.go.com/US/wireStory/stock-market-today-asian-stocks-mixed-after-dow-111980658 Accessed 17 July 2024
- “A widespread rally sends Wall Street to records, and the Dow leaps 740 points – Los Angeles Times” https://www.latimes.com/business/story/2024-07-16/stock-market-today-a-widespread-rally-sends-wall-street-to-records-and-the-dow-leaps-740-points Accessed 17 July 2024
- “Traders see the odds of a Fed rate cut by September at 100% – CNBC” https://www.cnbc.com/2024/07/16/traders-see-the-odds-of-a-fed-rate-cut-by-september-at-100percent.html Accessed 17 July 2024
- “Dow closes at record high after Trump survives assassination attempt – CNN Business” https://edition.cnn.com/2024/07/15/markets/us-markets-trump/index.html Accessed 17 July 2024
- “Trump Media, gun stocks surge after assassination attempt – Reuters” https://www.reuters.com/markets/us/trump-media-crypto-stocks-jump-odds-trump-victory-rise-after-shooting-2024-07-15/ Accessed 17 July 2024
- “2023 In Review: Stock Market Resilience And The Rise Of The Magnificent Seven – Forbes” https://www.forbes.com/sites/greatspeculations/2023/12/26/2023-in-review-stock-market-resilience-and-the-rise-of-the-magnificent-seven/?sh=4b7207bf5c5c Accessed 4 March 2024
- “2023 Review – Magnificent Seven Lead Domestic Large Cap Outperformance – Forbes” https://www.forbes.com/sites/greatspeculations/2024/01/22/2023-in-review/?sh=7b2854a1690b Accessed 6 March 2024
- “Major US Stock Indexes Hit Records as Nvidia Rekindles AI Rally – Bloomberg” https://www.bloomberg.com/news/articles/2024-02-22/major-us-stock-indexes-hit-records-as-nvidia-rekindles-ai-rally Accessed 4 March 2024
- “As S&P 500 breaches 5,000, its valuation hits lofty levels as well – Reuters” https://www.reuters.com/markets/us/sp-500-breaches-5000-its-valuation-hits-lofty-levels-well-2024-02-08/ Accessed 4 March 2024
- “The five warning signs that we’re at the start of another 2000-style stock market bubble – Yahoo! Finance” https://news.yahoo.com/five-warning-signs-start-another-120000651.html Accessed 4 March 2024
- “Investors should stay invested despite all-time high – UBS Insights” https://www.ubs.com/global/en/wealth-management/insights/chief-investment-office/house-view/daily/2024/latest-23012024.html Accessed 4 March 2024