Important Information
You are visiting the international Vantage Markets website, distinct from the website operated by Vantage Global Prime LLP
( www.vantagemarkets.co.uk ) which is regulated by the Financial Conduct Authority ("FCA").
This website is managed by Vantage Markets' international entities, and it's important to emphasise that they are not subject to regulation by the FCA in the UK. Therefore, you must understand that you will not have the FCA’s protection when investing through this website – for example:
- You will not be guaranteed Negative Balance Protection
- You will not be protected by FCA’s leverage restrictions
- You will not have the right to settle disputes via the Financial Ombudsman Service (FOS)
- You will not be protected by Financial Services Compensation Scheme (FSCS)
- Any monies deposited will not be afforded the protection required under the FCA Client Assets Sourcebook. The level of protection for your funds will be determined by the regulations of the relevant local regulator.
If you would like to proceed and visit this website, you acknowledge and confirm the following:
- 1.The website is owned by Vantage Markets' international entities and not by Vantage Global Prime LLP, which is regulated by the FCA.
- 2.Vantage Global Limited, or any of the Vantage Markets international entities, are neither based in the UK nor licensed by the FCA.
- 3.You are accessing the website at your own initiative and have not been solicited by Vantage Global Limited in any way.
- 4.Investing through this website does not grant you the protections provided by the FCA.
- 5.Should you choose to invest through this website or with any of the international Vantage Markets entities, you will be subject to the rules and regulations of the relevant international regulatory authorities, not the FCA.
Vantage wants to make it clear that we are duly licensed and authorised to offer the services and financial derivative products listed on our website. Individuals accessing this website and registering a trading account do so entirely of their own volition and without prior solicitation.
By confirming your decision to proceed with entering the website, you hereby affirm that this decision was solely initiated by you, and no solicitation has been made by any Vantage entity.
I confirm my intention to proceed and enter this website Please direct me to the website operated by Vantage Global Prime LLP, regulated by the FCA in the United KingdomBy providing your email and proceeding to create an account on this website, you acknowledge that you will be opening an account with Vantage Global Limited, regulated by the Vanuatu Financial Services Commission (VFSC), and not the UK Financial Conduct Authority (FCA).
-
Please enter a valid email address
-
Please tick the checkbox to proceed
-
Please tick the checkbox to proceed
Please tick all to proceed
×
-
 REGISTER
  LOGIN
LOGIN-

View More
SEARCH
Keywords
- Forex Trading
- Vantage Rewards
- Spreads
Popular Search
- Trading Accounts
- MT4
- MT5
- Copy Trading
- Promotions
Thank you for your interest in viewing this course content. To continue, please fill in the form below.
![]()
xxxxxxxxxx
Please enter your name
xxxxxxxxxx
Please enter a valid email
Email is case sensitive.
Where did you hear about us ?
Please tick the checkbox to proceed
Demo Account Form
You are not an existing user. Please register to continue.
xxxxxxxxxx
Please enter your frist name
xxxxxxxxxx
Please enter your last name
xxxxxxxxxx
Please enter a valid email
xxxxxxxxxx
Please enter a valid country
No results found
xxxxxxxxxx
Please enter a valid province
No results found
xxxxxxxxxx
No results found
xxxxxxxxxx
Please enter your phone
Please tick the checkbox to proceed
Important
Vantage Global Limited does not accept applications from Australian residents.
Due to regulatory requirements, when you click 'continue' you will be redirected to the Australian website of Vantage, which is operated by Vantage Global Prime Pty Ltd - a company registered in Australia and regulated by the Australian Securities and Investments Commission (ASIC), AFSL no. 428901.
CONTINUEPlease wait
Error! Please try again.
![]()
Thank you
You can proceed and enjoy the course! You will be redirected shortly.

5.1 What is fundamental analysis in the context of indices?
Fundamental analysis aims to discern the intrinsic value of an asset. It involves understanding and studying the various factors that could impact its price, and using the findings as the basis for informed trading decisions.
When used to analyse a stock, fundamental analysis involves looking at internal factors such as the company’s financials and fundamentals, as well as external factors like political events, news, scandals or competitor landscape that could impact the stock.
However, since an index is a benchmark that references anywhere from tens to hundreds of different stocks, fundamental analysis in the context of indices trading can only examine common external factors that impact the constituents tracked. This would range from economic indicators, political events and sector performance.
Fundamental analysis is a useful skill that any serious index investor should hone. At its most basic level, fundamental analysis involves keeping up with the news and taking note of relevant development and potentially impactful events.
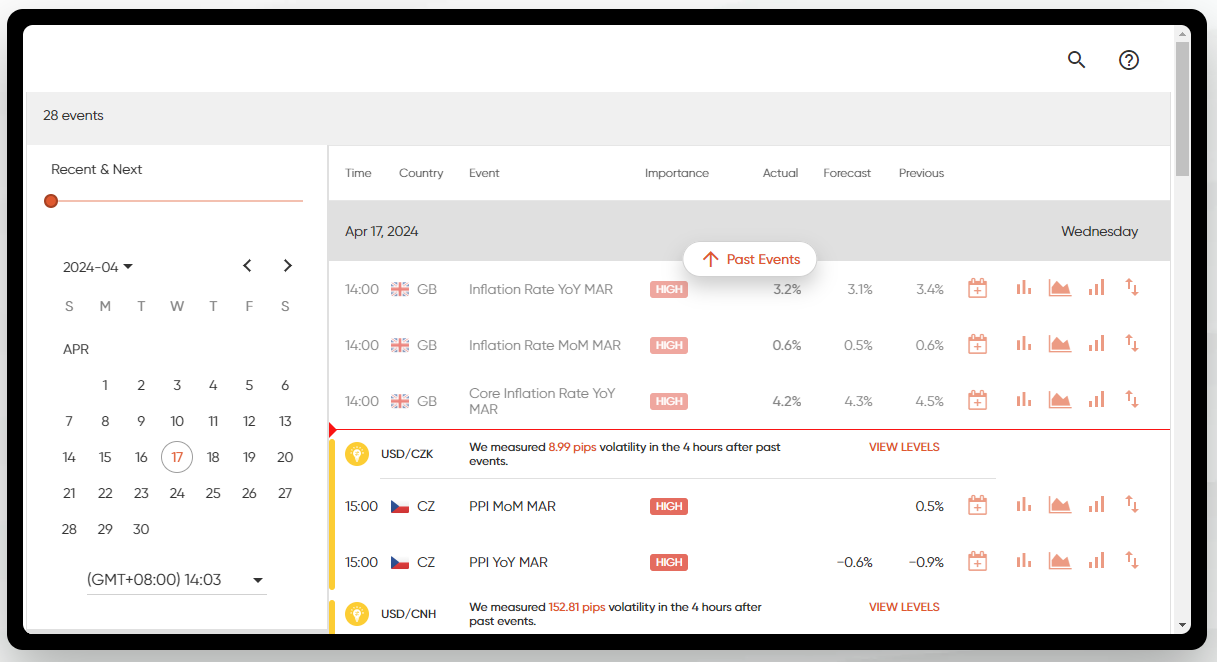
Those who are interested in developing their fundamental analysis skill may find it useful to have access to an economic calendar – this is a collection of important events such as earnings reports, interest rate announcements, elections, wars, etc, that have an impact on the macroeconomic environment.
Here’s an example of what an economic calendar looks like:
5.2 Economic indicators affecting indices
Gross Domestic Product (GDP)
Since economic growth and index readings are closely related, strong GDP numbers can have a positive influence on major stock market indices. This can be readily observed; many important indices such as the S&P 500 have been seen to rally upon news of good GDP results [1].
Central bank interest rate
When a central bank cuts interest rates, it reduces the cost of borrowing, leading to more credit entering the economic system. This is by design, and is used as a means to stimulate consumption and get a sluggish economy moving.
One side effect of lowering interest rates is that more money is invested into the stock market.
Afterall, if the cost to borrow is low enough, investors will be motivated to invest using debt, in the hopes that investment returns will be high enough to pay for the cost of borrowing.
Extra funds entering the stock market will drive up prices, which leads to a rise in index readings. The reverse can also happen; when a central bank raises interest rates, stock markets experience pullbacks as investors sell off holdings to generate cash.
This leads to falling share prices, which brings down stock market indices.
Inflation rates
When inflation increases in a country, the cost of living gets driven up. This means consumers have to pay more for essentials like food, housing, transport and utilities, which leaves them with less money to spend.
This results in lowered profits in discretionary sectors such as fashion, travel, household appliances, luxury items, as people cut back on non-essential purchases.
On the corporate side of things, profit margins become squeezed due to increased cost of raw materials. This can negatively affect earnings and share prices.
Thus, when inflation trends upwards, indices can trend downwards in response, due to the stock market being dragged down by depressed earnings and slowdowns in consumption.
Unemployment rate
The unemployment rate of a country can have a similar effect as high inflation on market indices. In advanced economies such as the US, consumer spending is a key driver of economic growth [2].
Consumer spending, of course, comes from wages from employment, and thus, if unemployment goes up, consumer spending would be reduced. This can, in turn, slow down economic growth, which is reflected in market indices as stagnation.
5.3 Sector performance and its impact on indices
Indices are composed with reference to different constituents, drawn from multiple sectors. The performance of sectors tracked in an index would therefore have an impact on its reading.
For example, if the majority of the sectors tracked in an index made gains, while the other sectors turned in neutral to mild declines, the index is likely to increase. The advances in the sectors that performed well were enough to cancel out the mild losses seen in those that did not.
This is a rudimentary explanation of how sector performance can impact indices. But in reality, the level of impact attributable to sector performance would depend on the weighting used in the index.
Recall that indices employ different weightings. They can be market-capitalisation weighted, price-weighted, or equal-weighted (or unweighted). Let’s take a look at the effect of sector performance on each of these types of indices.
Sector performance and market-cap weighted indices
In a market-cap weighted index, constituents are ranked by market capitalisation. The higher the market cap of a company, the more influence its stock has on the index.
For these types of indices, sector performance matters only if the top constituents happen to belong to the same sector.
Case in point: The Nasdaq 100, in which the top nine constituents all happen to be in the technology sector. These nine stocks make up around 48% of the index at the time of writing [3].
Hence, during a slowdown in the tech sector, it is conceivable that the Nasdaq 100 would be significantly impacted as well.
But remember that’s by design. Market indices are created as a benchmark of their respective market segments, allowing investors to get a quick and accurate snapshot of their performance.
There’s no point following the Nasdaq if it couldn’t accurately measure the changes in the sectors it was designed to track.
Sector performance and price-weighted indices
In a price-weighted index, constituents are ranked according to their share prices. Stocks that are higher priced have more influence on the index than those that are lower priced.
Again, the impact of sector performance on a price-weighted index depends on how closely related the largest constituents on the index are. If, say, the top 20 constituents happen to belong to the same sector, a poor performance is likely to see a drop in average share price, which would also cause a drop in the reading of the index.
However, there may be a few highly-priced stocks in the sector that manage to defend their prices. If so, these outliers can have a moderating effect on the downward pressure exerted by poor sector performance, preventing the index from falling too far downwards.
Sector performance and unweighted indices
Equal-weighted (or unweighted) indices do not rank their constituent stocks; instead the simple average of all share prices tracked is used as the index’s reading.
For this type of indices, the impact of sector performance would depend on the actual mix of constituent stocks. Here’s an example to illustrate how that works.
Let’s assume that the ABC Index measures 10 different sectors, tracking the top 5 companies in each sector.
If 8 out of the 10 sectors happen to perform poorly, a plunge in the ABC Index is to be expected.
However, if only three of the 10 sectors retracted, while five sectors advanced and the other two remained neutral, mathematics tells us we should expect a spike in the ABC Index.
5.4 Global events and market sentiments
As the recent few years have clearly demonstrated, the stock markets are highly sensitive to global events, such as wars, elections, supply chain issues, pandemics and recessions. Market disruptions are accompanied by share price changes, which show up as volatility in the indices that benchmark the markets.
Furthermore, the stock markets are ultimately driven by humans deciding whether to buy or to sell, which is why market sentiment can also exert a powerful effect on indices. Even when fundamental factors are sound, panic or fear among investors can prompt sell-offs that quickly grow into a market crash.
One example of this effect was seen in May 2023, when an AI-generated fake photo of an explosion at the White House was circulated via social media. The ensuing panic sell-offs promoted a flash crash, causing US stock indices to take a hit [4].
5.5 Case study: 2023, as told by the S&P 500
To help you better understand how indices behave in the real world, let’s go through a brief recap of the S&P 500’s performance in 2023, and the reasons why.
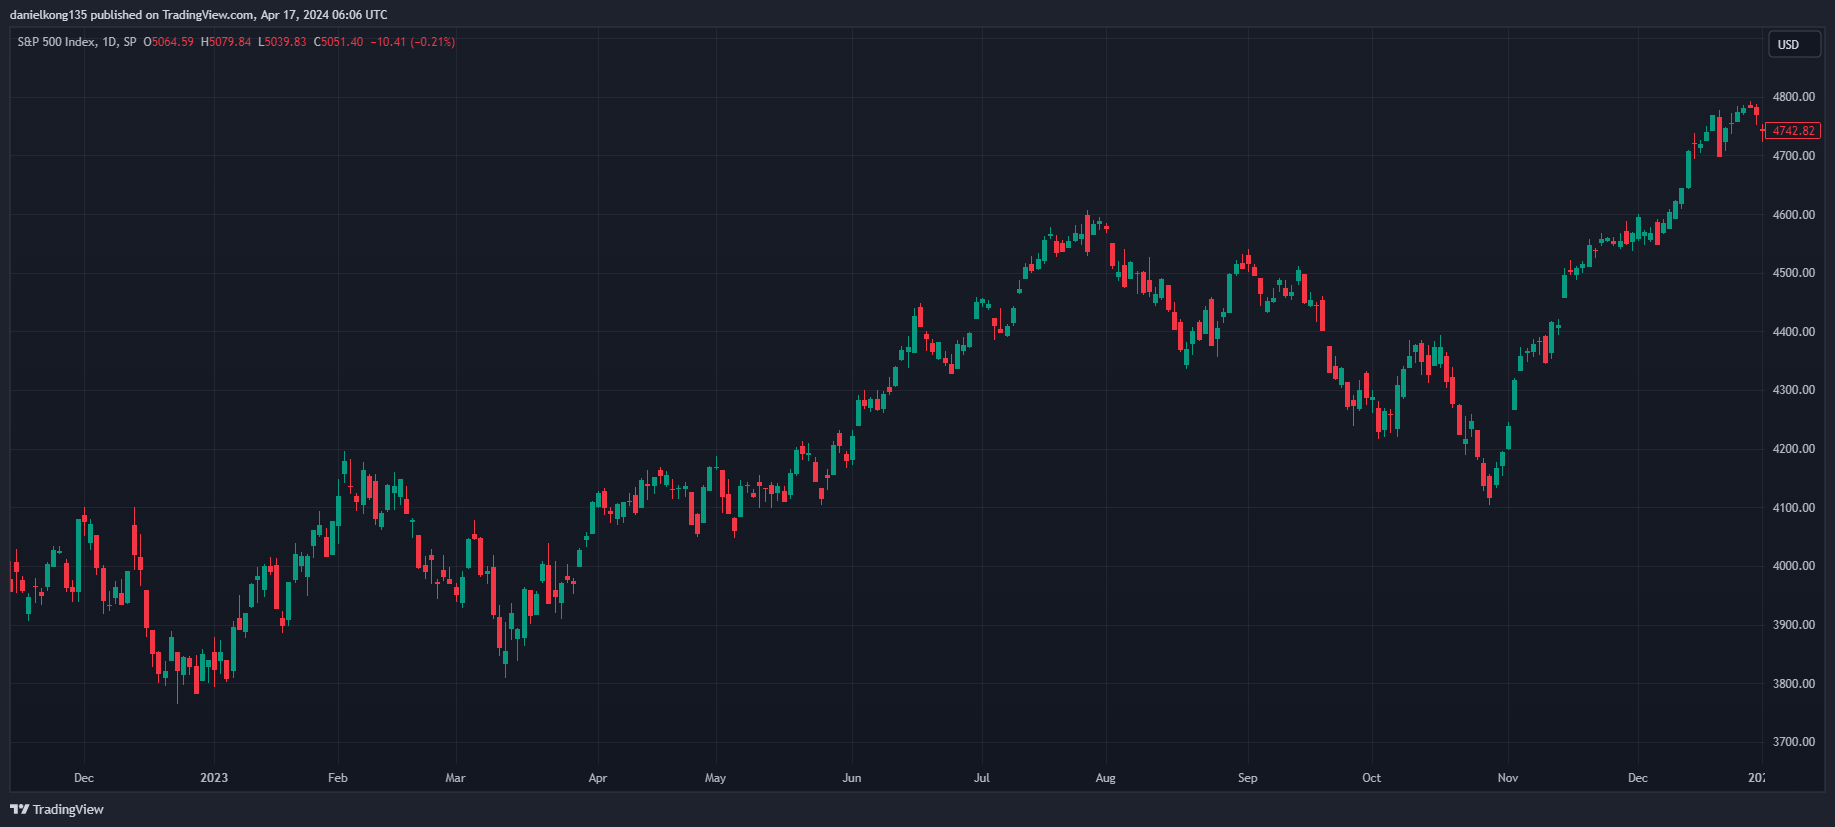
The screenshot above shows the price chart of the S&P 500 in the year 2023. Overall it was a good year for bullish investors, with the index ending on an all-year high. But go back to the beginning of the year you can see that things were looking quite different.
The first three months of the year saw the S&P 500 making a small gain, then quickly falling back down. This was likely due to elevated levels of worry in the markets as global economic recovery continued to slow as the Russian-Ukraine war raged on with no signs of stopping [5].
Also, inflation in the US remained stubbornly high exceeding 6% [6]. This prompted the US Federal Reserve to maintain a hawkish stance, and even going on to raise interest rates a further four times throughout the year. This was on top of the seven interest rate increases in 2022, a year when the S&P 500 lost a massive 19.4% [7].
These significant events should have continued to keep the S&P 500 muted. But as you can see from the price chart, the index started charting an upwards trend between April to August that year – even as when three of the four interest rate hikes for the year took place.
The markets underwent a short correction during the third quarter of the year, despite a strong labour market and robust consumer spending. But it is possible that the positive effects of these two singles of economic resilience needed some time to be reflected in stock prices.
The trigger seemed to be the much-awaited declaration by the US Federal Reserve that it would pause interest rate hikes for the rest of 2023. This gave investors some sorely needed relief and renewed confidence of further loosening in monetary policy come 2024 [8].
Plus, the breakthroughs made in generative AI by ChatGPT in 2023 also contributed to positive market sentiment, with tech stocks making eye-watering gains for the year: NVDA, 233.6%, AMZN, 77.79% and MSFT 54.7% [9].
All told, the interplay of these various macroeconomic factors helped drive the S&P 500 to a gain of over 24% – one of the index’s best years in recent years. [10]

Module recap
- When trading indices, fundamental analysis can offer investors findings that may be useful for arriving at informed decisions. It is focused on understanding the various macroeconomic factors that impact an index.
- Market indices are sensitive to economic conditions. The economic indicators that affect indices include GDP, central bank interest rates, inflation and unemployment rates.
- Sector performance can also influence indices, although the extent of the impact depends on how the index is weighted. Generally, market-cap weighted and price-weighted indices are more sensitive to the sector performance of their most important constituents. Equal-weighted indices are less affected than the other two types of indices.
- Additionally, indices are also impacted by global events and market sentiment. Investors should pay attention to news and developments with the potential to disrupt stock markets. As well, be vigilant about verifying news sources, so as not to be misled by fake news.
References
- “S&P 500 Gains And Losses Today: Index Advances As GDP Growth Beats Expectations – Investopedia”. https://www.investopedia.com/s-and-p-500-gains-and-losses-today-index-advances-as-gdp-growth-beats-expectations-8550041. Accessed 17 April 2024.
- “How does consumer spending impact the health of the economy? – US Bank”. https://www.usbank.com/investing/financial-perspectives/market-news/consumer-spending.html. Accessed 17 April 2024.
- “NASDAQ 100 – MarketScreener”. https://www.marketscreener.com/quote/index/NASDAQ-100-4946/components/. Accessed 17 April 2024.
- “AI-Generated Hoax of Pentagon Explosion Sparks Brief Market Sell-Off – Yahoo! Finance”. https://finance.yahoo.com/news/ai-generated-hoax-pentagon-explosion-191348029.html. Accessed 17 April 2024.
- “A Fragile Recovery – OECD”. https://www.oecd.org/economic-outlook/march-2023/. Accessed 17 April 2024.
- “The S&P 500 made a stellar comeback in 2023. What’s next? – Endowus Insights”. https://endowus.com/insights/s-p-500-2023-performance. Accessed 17 April 2024.
- “A Timeline Of The Fed’s 2022–2023 Rate Hikes – TheStreet”. https://www.thestreet.com/fed/fed-rate-hikes-2022-2023-timeline-discussion. Accessed 17 April 2024.
- “The Fed will likely cut rates in 2024 but won’t be rushed: Waller – Yahoo! Finance”. https://finance.yahoo.com/news/the-fed-will-likely-cut-rates-in-2024-but-wont-be-rushed-waller-162058939.html. Accessed 17 April 2024.
- “2023 Recap: Triumphs And Trials In The US Stock Market And Beyond – POEMS”. https://www.poems.com.sg/market-journal/2023-recap-triumphs-and-trials-in-the-us-stock-market-and-beyond/. Accessed 17 April 2024.
- “Visualizing 150 Years of S&P 500 Returns – Visual Capitalist”. https://www.visualcapitalist.com/150-years-of-sp-500-historical-returns/. Accessed 17 April 2024.
Previous Lesson
Next Lesson